Key Summary
- Base Analytics has officially launched in the UK, bringing next-level data clarity to scaling e-commerce operations.
- The redesigned tool is now fully integrated into your Base.com panel under Orders → Statistics.
- Track your full journey from GMV → Net Profit, identify your most profitable channels, and see exactly where your costs are eroding margin.
- Includes daily refreshed data, marketplace insights, country profitability, and SKU-level margin reporting.
- Built for high-volume sellers who need facts—not gut feeling—to grow smarter.
Did you know thousands of online sellers lose millions every month, simply because they don’t know which of their products actually make money? If you want to boost profits, cut costs, and outsmart your competition, it all starts with your data.
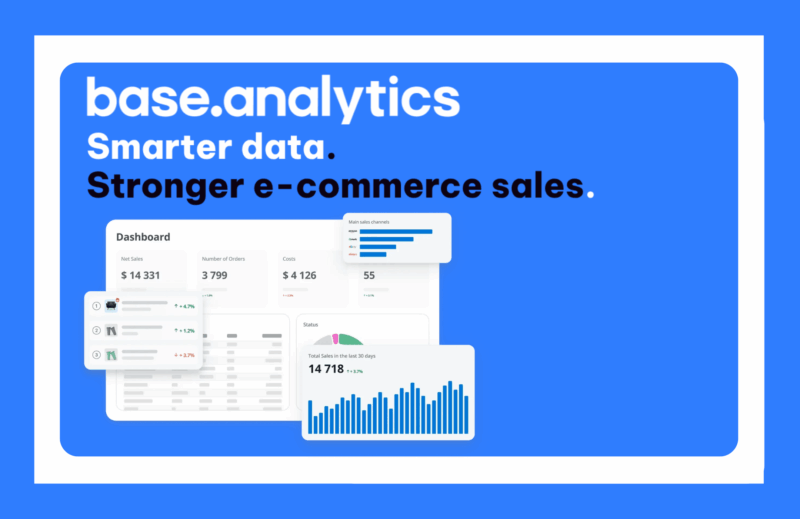
Introducing Base Analytics—now launched in the UK, redesigned, faster, and fully integrated into your Base.com panel. All your essential e-commerce insights, just one click away. 🚀
1. What is Base Analytics?
Base Analytics is our powerful, data-driven reporting platform that helps you make smarter, faster, and more profitable decisions. You’ll find it directly inside your Base.com panel under Orders → Statistics.
Here’s what you get:
✅ Daily refreshed sales reports powered by your Base.com data.
✅ Full margin transparency—see which channels drive real profit.
✅ Key sales metrics that replace intuition with evidence.
✅ SKU-level insights showing profitability for every product you sell.
With a completely refreshed design and smoother experience, the latest version of Base Analytics is not only more intuitive—it’s included for free in your Base.com plan.
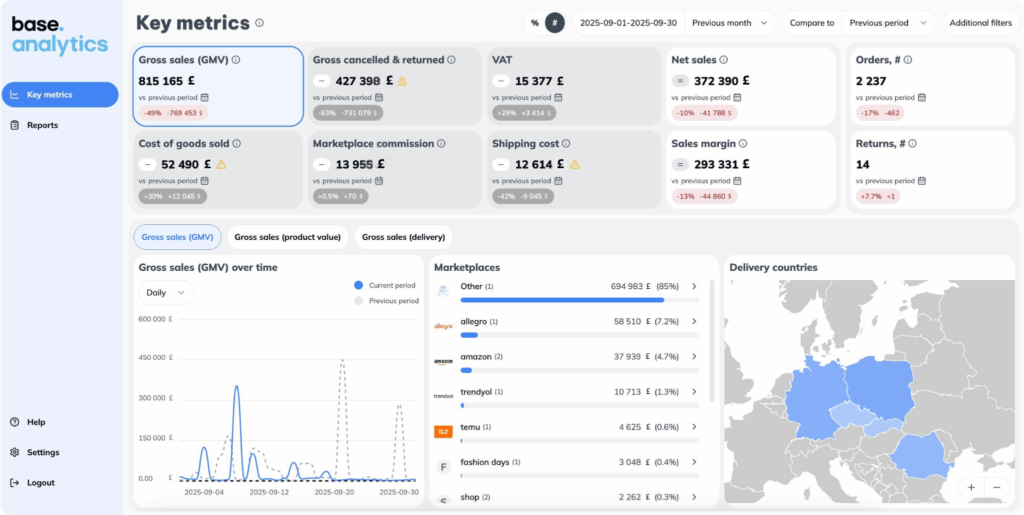
From GMV to Final Margin
Understanding your full sales journey—from gross to net—shouldn’t require spreadsheets.
Base Analytics breaks your performance into a simple, clear equation so you can instantly see:
- The fees that cut into your GMV
- The shipping and operational costs affecting your margin
- Where optimisation will make the biggest impact
This transparency helps you grow profit, not just revenue.
Sales Platforms Overview
Not all marketplaces are created equal.
Base Analytics shows you:
-
-
- Which platforms generate strong, consistent profit
- Which channels drive returns, fees, and avoidable costs
- How each marketplace contributes to net margin—not just gross sales
-
All visualised in clean charts and tables.
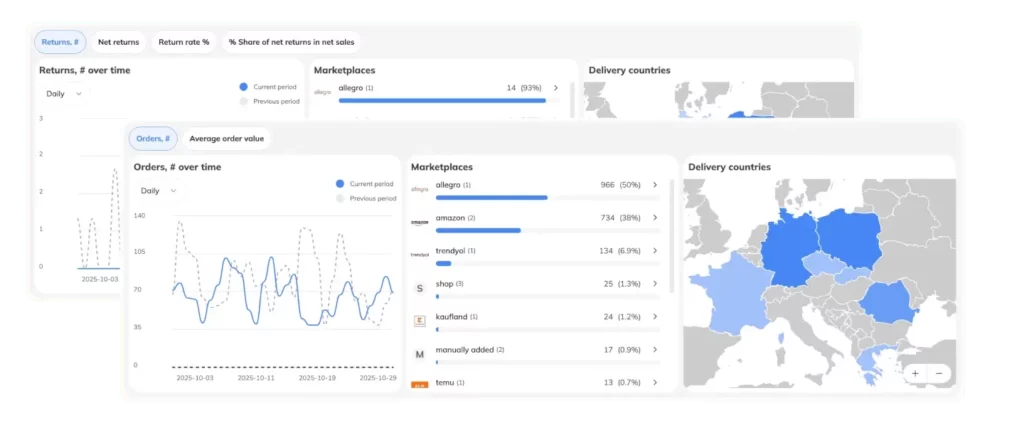
Delivery Countries
Selling abroad? Great—if it’s profitable.
With Base Analytics you can:
-
-
- Analyse margins by destination country
- Compare performance by region
- Identify markets draining your budget
- Double down on high-performing locations
-
Your international strategy becomes clearer and far more efficient.
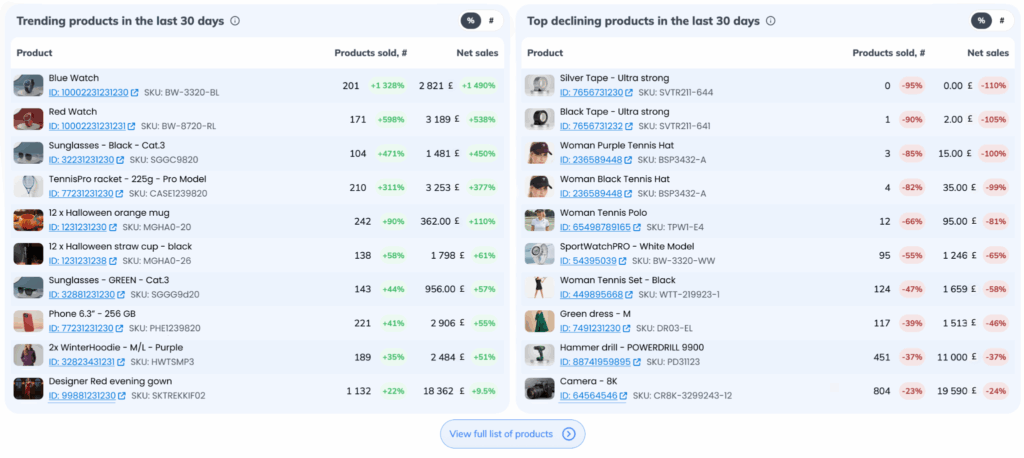
Bestselling Products
Spot what’s rising and what’s declining.
Base Analytics highlights:
-
-
- Trending products gaining momentum
- Slow movers losing demand
- Profitability per SKU
- Direct links to product cards in Base
-
This is essential for replenishment, forecasting, and supplier negotiations.
2. Base Analytics in Action: How Sellers Boost Profit
Many sellers struggle with analytics—it’s complex and time-consuming. But the right questions reveal opportunities:
-
-
- Are all my products profitable?
- Are my marketing campaigns paying off?
- Am I losing money in specific marketplaces or countries?
-
Here’s how sellers use Base Analytics to answer them.
Spotting Sales Trends and Seasonality (Q4 Alert!)
A UK office & school supplies retailer reviewed their Back-to-School performance inside Base Analytics.
What they discovered:
– August–September was their most profitable period
– Post-season demand continued into late September
By keeping campaigns live longer, they generated thousands in extra margin.
Cross-Border Sales = Real Profit
A car accessories retailer using Base Analytics analysed performance by country and sales channel.
Results:
– Germany, Czechia, Italy → strong profit
– France & Spain → breaking even or losing money due to fees + returns
Action taken:
– Reduced activity in low-margin countries
– Increased focus on profitable regions
Outcome: Higher operating margin—even with fewer orders.
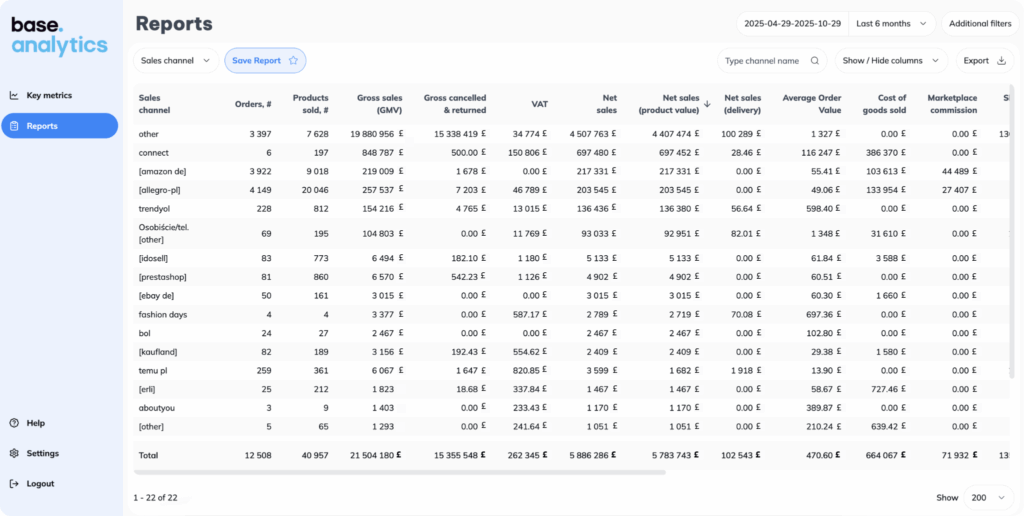
Supplier Comparison: Who Really Drives Profit?
Many sellers work with multiple suppliers but don’t know which products truly deliver margin.
Base Analytics lets you compare performance by supplier in seconds.
You’ll quickly see:
– Which brands deserve more ad spend
– Which lines disrupt margin
– Where renegotiation or delisting will improve profit
What Makes Base Analytics Different?
Most reporting tools stop at surface-level charts.
Base Analytics goes deeper by combining:
-
-
- Sales
- Product costs
- Fees
- Returns
- VAT
- Shipping
- Margin
-
All in one place, refreshed daily, across every channel.
It’s not just data—it’s clarity.
Ready to See Your Data in Action?
Let your data start working for you.
Get Base Analytics free inside your Base.com panel.
👉 Register free today
Or explore more features:
FAQ
Q1. What is Base Analytics?
Base Analytics is a fully integrated platform inside Base.com that reveals your sales, margin, channel, product, and country performance.
Q2. How often is the data refreshed?
Data updates daily, giving you accurate insight at all times.
Q3. Is Base Analytics included for free?
Yes. Base Analytics is included in your Base.com plan at no extra cost.