

For a typical Indian sale event, keep 2.5 to 3.5 times your normal daily velocity per day of the sale window on A-class SKUs, plus a 10-15% safety buffer, minus expected returns already in transit. The exact figure depends on category, channel mix, and how fast you can replenish mid-sale.
That last variable changes the answer more than any other.
Why the Wrong Answer Costs More Than a Stockout
Most Indian sellers treat this as a single decision made three weeks before Diwali. It is actually two decisions with opposite failure costs.
Buy too little, and you lose revenue on the year’s highest-traffic days. Redseer reported that the first 11 days of the 2025 festive season saw GMV of over ₹60,000 crore, roughly 3.5 times business-as-usual levels, with about 90 million shoppers participating. Missing that window means waiting twelve months for the next one.
Answering how much inventory to keep for ecommerce sale windows too generously has the opposite effect: you convert working capital into warehouse rent. Unsold festive stock does not become worthless; it becomes illiquid precisely when your cash conversion cycle is most stretched.
The asymmetry matters. A stockout costs you gross margin on units you did not sell. Dead stock costs you the full landed cost of units you did buy, plus storage, plus the opportunity cost of the acquisition spend that money could have funded.
So the honest framing of how much inventory to keep for ecommerce sale events is not “how much can I sell” but “how much can I afford to be wrong by, in each direction.”
Three inputs decide that:
- Replenishment speed. If you can restock a SKU within 48 hours mid-sale, you can plan tighter. If your inbound lead time is three weeks, you are buying blind for the whole window.
- Shelf life and obsolescence. A cotton kurta sells next season. A festive-print packaging SKU does not.
- Working capital headroom. The theoretical optimum is irrelevant if it breaches your cash position.
The Core Formula: How to Calculate How Much Inventory to Keep for Ecommerce Sale Periods
Work at SKU-channel level, not SKU level. Your Flipkart Big Billion Days mix will not match your Shopify mix, and averaging the two produces a number that is wrong for both.
Step 1: Establish Baseline Daily Velocity per SKU
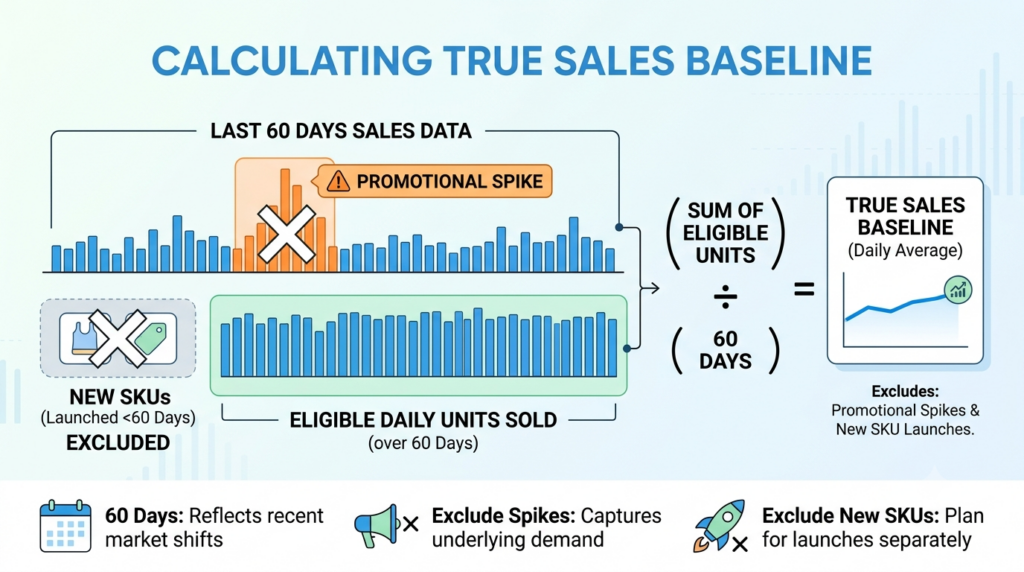
Take the trailing 60 days of units sold, excluding any promotional spike, and divide by 60.
Use 60 days rather than 90 because Indian demand shifts materially in the pre-festive build-up. A 90-day window pulls in a quieter period and understates your true baseline.
Exclude SKUs launched inside the window. New SKUs need a forecast, not a baseline, and should be planned conservatively.
Step 2: Apply a Sale Uplift Multiplier
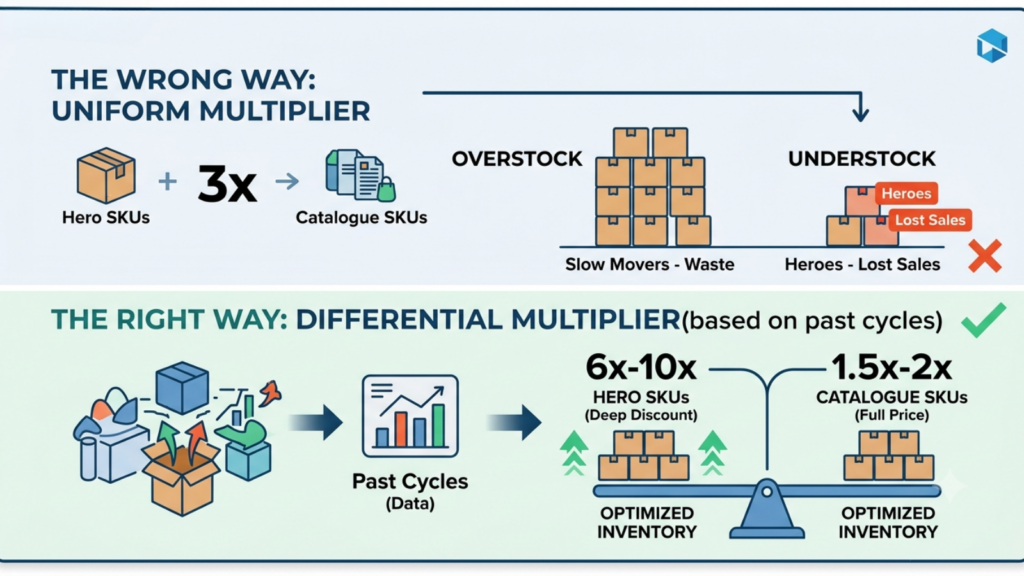
This is where most plans go wrong, because sellers apply one multiplier across the catalogue.
Uplift is not uniform. Deep-discount hero SKUs can see 6-10x baseline velocity. Full-price catalogue SKUs riding on incremental traffic often see only 1.5-2x. Averaging the two overstocks your slow movers and understocks your heroes.
Build the multiplier from your own last two sale cycles. If you do not have that data, start from these directional ranges and correct after the first cycle:
| SKU role in the sale | Typical uplift vs baseline | Confidence |
| Discounted hero/lightning deal SKU | 6-10x | Low without prior data |
| Featured A-class SKU, moderate discount | 3-5x | Moderate |
| Full-price catalogue SKU | 1.5-2x | Higher |
| Long-tail C-class SKU | 1-1.5x | Higher |
These are planning heuristics drawn from common operating practice, not published benchmarks. Replace them with your own numbers as soon as you have one cycle of data.
Step 3: Multiply by Sale Duration, Not Sale Length
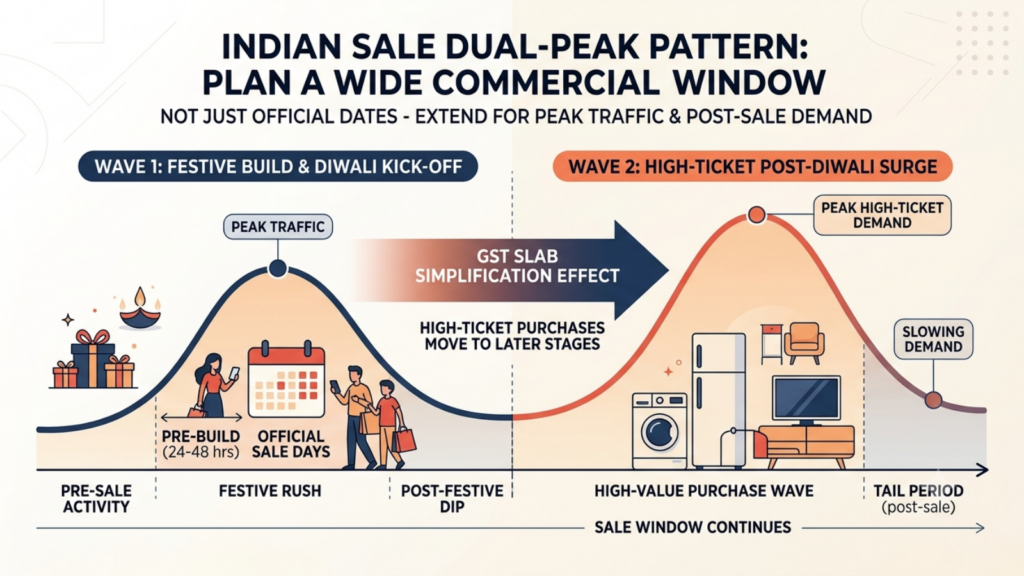
Indian sale events do not have one peak. Redseer identified a dual-peak pattern in 2025, with GST slab simplification pushing high-ticket purchases past Diwali into a second wave.
Plan the full commercial window, not the official sale dates. Traffic builds 24-48 hours before the announced start and demand does not fall to baseline immediately after.
For a six-day marketplace sale, plan a nine-day window: one day pre-build, six days sale, two days tail.
Step 4: Add Safety Stock Sized to Replenishment Speed

Safety stock is not a fixed percentage. It is a function of how long you would be exposed if demand runs above forecast.
- Replenishment under 48 hours: 10% buffer on A-class SKUs is usually sufficient.
- Replenishment 3-7 days: 15-20% buffer.
- Replenishment over 7 days, or imported stock: 25-30% buffer, because you have no second chance inside the window.
A useful sanity check: if your buffer is smaller than one replenishment cycle of demand, the buffer is decorative.
Step 5: Net Off Returns and RTO in Transit
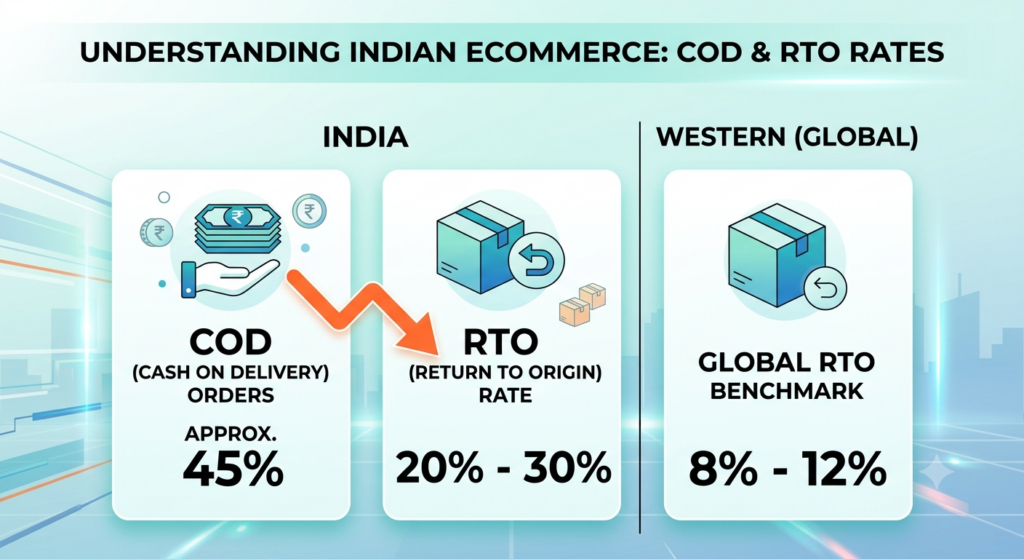
This step is skipped almost universally, and it is the one that makes the Indian answer different from the Western one.
COD still accounts for roughly 45% of Indian D2C orders, down from 55% in 2024 according to one 2026 industry survey. India’s average RTO rate sits between 20% and 30%, against a global benchmark closer to 8-12%, and COD-heavy categories can run higher. Treat both as directional and verify against your own courier reports.
Two consequences for quantity planning:
Units in RTO transit are your inventory. They are simply inventory you cannot sell for six to ten days. If 25% of your COD dispatches are coming back, a meaningful share of your sale-week outbound returns to the warehouse before the season ends.
Do not double-count them as available. Plan them as a separate late-window supply pool with a realistic sellable-condition rate, not as stock you can promise on day two.
Worked Example: One A-Class SKU
| Input | Value |
| Baseline daily velocity | 40 units/day |
| SKU role | Featured, moderate discount |
| Uplift multiplier | 4x |
| Planned window | 9 days |
| Replenishment lead time | 6 days |
| Safety buffer | 18% |
| Expected sellable RTO return inside window | 6% of dispatched |
Gross requirement: 40 × 4 × 9 = 1,440 units. Safety stock at 18%: 259 units. Less sellable RTO returning inside window: approximately −86 units. Plan quantity: approximately 1,610 units
Run this per SKU per channel. For a 200-SKU catalogue that is unmanageable in a spreadsheet, which is the practical reason the question of how much inventory to keep for ecommerce sale windows becomes a systems question rather than a planning question past a certain scale.
How Much Inventory to Keep for Ecommerce Sale Events by Business Size
Scale changes the constraint. A ₹5 crore brand is limited by cash. A ₹100 crore brand is limited by warehouse throughput and supplier capacity.
| Annual GMV | Primary constraint | Practical buffer on A-class | Planning horizon |
| Under ₹1 crore | Cash | 10-12%, tight | 2-3 weeks |
| ₹1-10 crore | Cash and supplier MOQ | 12-18% | 4 weeks |
| ₹10-50 crore | Warehouse throughput | 15-20% | 6-8 weeks |
| ₹50 crore+ | Supplier capacity and inbound scheduling | 15-25%, SKU-tiered | 10-12 weeks |
Smaller brands should deliberately under-buy the long tail and concentrate stock in the top 20% of SKUs. Running out of a C-class SKU during a sale costs very little. Running out of a hero SKU costs the sale.
Larger brands face the opposite risk. Supplier capacity is booked months ahead during the Indian festive season, so the decision on how much inventory to keep for ecommerce sale periods has to be made before the demand signal is clear, which raises the value of scenario planning over point forecasts.
Industry-Wise: How Much Inventory to Keep for Ecommerce Sale Events by Category
Category is the single strongest determinant. Return rate, shelf life, and discount elasticity all move together with what you sell.
Two data points frame the ranges below. NRF benchmark data puts the overall ecommerce return rate at roughly 19-20%, with apparel at 20-40%, footwear 17-30%, electronics 8-15%, and beauty 4-12%. India-specific reporting puts the national average nearer 15-20%, with fashion at 25-30% and electronics at 5-8%.
Verify these against your own returns data before adopting them. They are directional benchmarks aggregated from vendor and industry publications, not a single authoritative study.
1. Fashion and Apparel: Plan for Returns Before You Plan for Sales

Fashion is the highest-variance category in Indian ecommerce and the second largest by GMV at roughly 22%.
- Buffer: 20-25% on A-class, higher than any other category.
- Why: Return rates of 25-30% mean a quarter of your dispatched units come back. Size-fit returns concentrate in the middle sizes, which are also your fastest sellers.
- Size-curve rule: Do not buffer uniformly across sizes. Buffer the middle of the curve heavily and the extremes barely. Running out of M and L during a sale is a revenue event. Running out of XXS is not.
- Obsolescence: Moderate. Basics carry over. Trend-led and occasion wear does not.
- Planning note: Because returned units are frequently resellable, fashion brands can plan slightly leaner on late-window supply if their returns processing is fast. If returns sit in a quarantine bin for ten days, that advantage disappears.
2. Beauty and Personal Care: Buy Deeper, But Watch Expiry

Beauty carries the lowest return rates in Indian ecommerce, commonly cited at 1-5% domestically and 4-12% in global benchmarks, because hygiene rules discourage returns.
- Buffer: 12-15% on A-class.
- Why lower: Almost everything you dispatch stays dispatched. Your available-to-promise figure is far more reliable than a fashion brand’s.
- The real constraint is expiry, not returns. Batch-managed SKUs with 18-24 month shelf life leave little room for a bad buy. Over-ordering a shade or variant means writing it off, not carrying it forward.
- Planning note: Buffer by variant, not by product. Shade and SKU-variant demand is highly skewed; two shades typically carry most of the volume.
3. Consumer Electronics and Mobile Accessories: Tight Buffers, High Capital Risk

Electronics is the largest Indian category by value, accounting for roughly 30% of GMV, and returns are low at around 5-8% domestically.
- Buffer: 8-12% on A-class. The tightest of any category.
- Why: Low returns plus high unit cost. A 25% buffer on a ₹18,000 ASP SKU is an enormous cash commitment for protection you statistically do not need.
- Price erosion is the hidden cost. Unsold electronics depreciate in list price. Carrying stock into the next quarter often means selling it at a lower price than you planned.
- Planning note: Accessories behave differently from devices. Cables, cases and chargers have low ASP, low returns and high attach-rate volume, and can carry a 15-18% buffer without material capital risk.
4. Home, Kitchen and Furniture: Space Is the Binding Constraint

Home and furniture return rates sit around 15-20% globally, driven by size, colour and assembly issues.
- Buffer: 12-18% on A-class.
- Why the ceiling is physical: Large-format SKUs consume cubic volume disproportionately. Your warehouse runs out of space long before it runs out of budget.
- Reverse logistics is slow and expensive. A returned dining set takes far longer to re-enter sellable stock than a returned t-shirt.
- Planning note: Plan buffer in cubic metres alongside units. A unit-based plan that ignores volume will physically not fit.
5. FMCG, Food and Beverage: Velocity High, Shelf Life Short

Food and beverage return rates run around 12% in global benchmarks, though Indian marketplace policy often restricts consumable returns further.
- Buffer: 15-20% on A-class, but only for SKUs with more than six months of remaining shelf life.
- Why: High velocity justifies a healthy buffer. Short shelf life punishes over-buying immediately.
- Quick commerce changes the maths. Blinkit, Zepto and Instamart demand replenishment in days, not weeks. FMCG brands should hold buffer centrally and push to dark stores frequently, rather than committing deep stock to individual nodes.
- Planning note: Enforce FEFO, not FIFO. First-expiry-first-out is the only correct rotation for dated stock.
6. Health, Wellness and Supplements: Predictable Demand, Regulatory Risk

Supplements show low return rates, around 7% in global data, and unusually predictable repeat demand.
- Buffer: 12-15% on A-class.
- Why moderate: Repeat-purchase behaviour makes forecasting more reliable than in discretionary categories.
- Batch and expiry discipline is mandatory, not optional. Regulatory exposure on expired dispatch is materially worse than the cost of a stockout.
- Planning note: Subscription volume should be ring-fenced from sale-available stock. Committed subscription units are not promotional inventory.
7. Jewellery, Watches and Accessories: Low Volume, High Value

- Buffer: 8-12% on A-class.
- Why tight: High ASP means every buffer unit is a large capital commitment, and obsolescence is low so unsold stock genuinely carries forward.
- Security and handling constraints limit how much you can practically hold at a single node.
- Planning note: For this category, under-buying is usually the correct error. Carrying cost is low, so a late replenishment costs less than blocked capital.
8. Baby, Toys and Juvenile: Size and Age-Band Complexity

- Buffer: 15-20% on A-class.
- Why: Age-band and size fragmentation resembles fashion, and gifting-driven demand spikes hard during festive windows.
- Safety and compliance: Returned units in this category should be inspected more rigorously than in most others before being restocked.
- Planning note: Gifting demand concentrates in the final 72 hours before Diwali. Front-loading stock too early can strand units at the wrong node.
Category Summary Table
| Category | Typical India return rate | Suggested A-class buffer | Primary risk if you over-buy |
| Fashion and apparel | 25-30% | 20-25% | Trend obsolescence |
| Beauty and personal care | 1-5% | 12-15% | Expiry write-off |
| Consumer electronics | 5-8% | 8-12% | Price erosion, capital lock-up |
| Home, kitchen, furniture | 15-20% (global) | 12-18% | Warehouse space |
| FMCG, food, beverage | ~12% (global) | 15-20% | Shelf-life write-off |
| Health and supplements | ~7% (global) | 12-15% | Expiry and compliance |
| Jewellery and accessories | Low | 8-12% | Capital lock-up |
| Baby, toys, juvenile | Moderate | 15-20% | Post-season demand collapse |
Return-rate figures blend Indian and global sources as noted above. Buffer ranges are planning heuristics, not published standards. Anchor them to your own last two cycles.
How Much Inventory to Keep for Ecommerce Sale Windows by Channel
Category tells you the buffer. Channel tells you where to physically place it.
| Channel | Fulfilment behaviour | Allocation guidance |
| Amazon FBA / Flipkart Smart Fulfilment | Stock committed in advance, cannot be pulled back mid-sale | Commit conservatively; hold flex stock in your own warehouse |
| Amazon Easy Ship / self-ship marketplace | Ships from your node | Highest flex; hold the shared buffer here |
| Myntra / Ajio (marketplace model) | Size-curve sensitive, high returns | Deepest buffer on middle sizes |
| Meesho | Price-led, high volume, high RTO | Buffer for RTO churn, not for velocity alone |
| Quick commerce (Blinkit, Zepto, Instamart) | Dark-store replenishment in days | Shallow node stock, deep central stock |
| Own D2C store | Full control, best margin | Protect stock here; it is your highest-contribution channel |
The rule underneath the table: commit deep only where you cannot recall stock, and hold your flexibility in the node you control.
Stock committed to a marketplace fulfilment centre in September is unavailable to your D2C store in October. That is a working capital decision disguised as a logistics decision.
The A/B/C Split: Where the Buffer Actually Goes
Uniform buffers waste money. Once you have a total number, the next question is distribution, because how much inventory to keep for ecommerce sale events matters far less than where inside the catalogue you keep it.
- A-class (top ~20% of SKUs, usually 70-80% of sale volume): Full category buffer. Live stock sync. Named owner watching them hourly.
- B-class (next ~30%): Half the A-class buffer. Standard sync cadence.
- C-class (long tail): No buffer. Sell to zero, close the listing, relist when replenished.
Verify the 20/80 split against your own data rather than assuming the Pareto ratio holds. In some Indian catalogues, particularly marketplace-heavy ones, the concentration is sharper still.
Deliberately letting C-class SKUs stock out during a sale is not a failure. It is how you fund the A-class buffer.
The Working Capital Ceiling Most Sellers Ignore
Every buffer calculation should terminate in a cash check. The correct answer to how much inventory to keep for ecommerce sale periods is always bounded by what you can pay for without breaching your cash position.
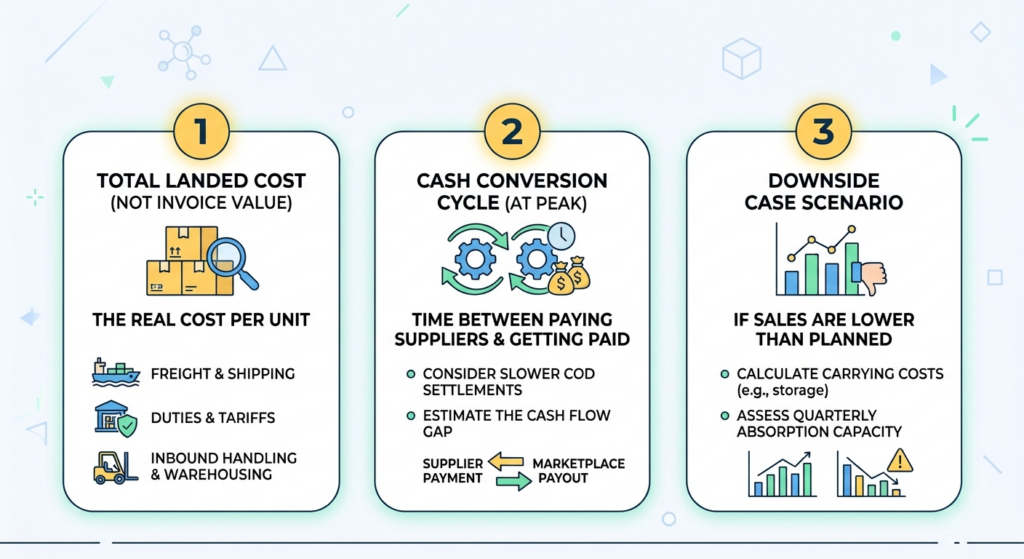
Run three numbers before you commit a purchase order:
- Total landed cost of the plan. Not invoice value. Include freight, duties, and inbound handling.
- Cash conversion cycle at peak. Marketplace payout cycles typically run 7-15 days after delivery confirmation. COD settlement is slower still. You will pay suppliers before marketplaces pay you.
- Downside case. If sell-through lands at 60% instead of 80%, what is the carrying cost, and can you absorb it for a full quarter?
If the downside case is unaffordable, the plan is too aggressive regardless of what the demand forecast says. Reduce the long tail first, not the heroes.
How Base.com Helps You Hold the Right Number
Base.com is an ecommerce operating system combining order management, product and inventory management, marketplace listing control, shipping, and workflow automation. Its Product Manager module explicitly combines ERP, WMS, and PIM functions, including inventory control, pricing, reservations, and stock documents.
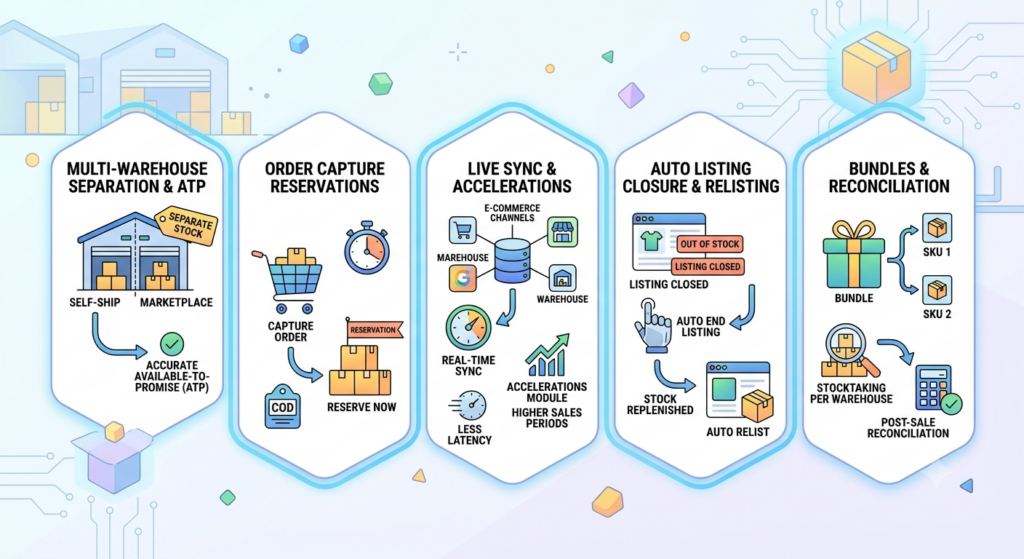
Four capabilities bear directly on quantity planning.
1. Multi-Warehouse Stock Separation for Accurate Available-to-Promise
Base.com supports assigning one or more warehouses to an inventory, each with separate stock levels, documents, deliveries and stocktakings.
This is what makes the channel allocation table above executable. Stock committed to marketplace fulfilment sits in its own warehouse and never appears in your self-ship available pool. Without that separation, your available figure is inflated, and every buffer calculation built on it is wrong.
2. Reservations at Order Capture, Not Dispatch
Base.com’s Product Manager supports reserving products before orders are paid.
For Indian sellers, this is the difference between a buffer that works and one that evaporates. With COD near 45% of D2C orders, an unshipped COD backlog silently consumes your buffer if stock is only decremented at dispatch.
Reserving at capture means the buffer you planned is the buffer you actually have.
3. Live Sync and the Accelerations Module
Base.com offers configurable stock synchronisation, every eight hours, hourly, or live, and ships a dedicated Accelerations module that raises synchronisation frequency for periods when higher sales are expected.
The connection to quantity planning is direct: the faster your sync, the smaller the buffer you need. A buffer is partly compensation for sync latency. Remove the latency, and you can safely hold less stock, which frees working capital.
4. Automatic Listing Closure and Relisting
Base.com can automatically end a listing when stock reaches zero and reactivate it when the product is replenished.
This is what makes the “no buffer on C-class” strategy safe. You can deliberately run the long tail to zero without risking oversell, because the listing closes itself, and it comes back the moment an inbound GRN posts, including overnight, without anyone at a desk.
5. Bundles, Stocktaking and Post-Sale Reconciliation
Bundles can be configured to split automatically into component SKUs when an order is fetched, which keeps component-level stock accurate during festive hamper season.
Separate stocktakings per warehouse let you reconcile one node at a time after the sale, rather than freezing the whole operation. Accurate post-sale reconciliation is what makes next cycle’s forecast better than this one’s.
Five Signals You Got the Number Wrong
Measure these within 14 days of the sale closing. They tell you whether your view of how much inventory to keep for ecommerce sale periods was too aggressive or too cautious, and by how much.
| Signal | What it means | Correction |
| Sell-through above 95% on A-class | You under-bought and lost revenue | Raise uplift multiplier |
| Sell-through below 60% | You over-bought | Cut long tail, tighten multiplier |
| Stockout hours above 5% of window on A-class | Buffer too thin or sync too slow | Raise buffer or move to live sync |
| Oversell rate above 0.5% | Sync latency, not stock shortage | Fix sync before buying more |
| Returns arriving after your reorder | You double-counted supply | Model RTO as a separate late pool |
Sell-through of 75-85% on A-class is a reasonable planning target for Indian sale events. It is a directional benchmark, not a published standard, and should be calibrated to your category’s carryover value.
Six Mistakes That Distort How Much Inventory to Keep for Ecommerce Sale Planning
- Applying one uplift multiplier across the catalogue. Hero SKUs and long-tail SKUs behave nothing alike.
- Forecasting at SKU level instead of SKU-channel level. Marketplace and D2C mixes diverge sharply during sales.
- Ignoring RTO in transit. In a COD-heavy category, this can be a large share of your sale-week dispatch.
- Buffering uniformly across sizes and variants. Middle sizes and hero shades need protection; extremes do not.
- Committing flexible stock to marketplace fulfilment centres. Once it is in, you cannot pull it back mid-sale.
- Planning quantity without a cash downside case. The optimum you cannot fund is not an optimum.
Deciding How Much Inventory to Keep for Ecommerce Sale Events Is a Data Problem, Not a Guess
The brands that get this right are not better at forecasting. They are better at measuring, and they carry less inventory as a result.
Every element of the calculation- baseline velocity, uplift by SKU role, category buffer, channel allocation, RTO netting- is derivable from data you already generate. The gap is almost always that the data sits in six systems and reconciles in none of them.
With festive GMV in India projected to cross ₹1.15 lakh crore in a 30-35 day window, the cost of guessing compounds every year. Base.com consolidates order, inventory, warehouse, and channel data into one platform, which is what turns how much inventory to keep for ecommerce sale planning from an annual argument into a calculation.
Buy to the number. Measure the variance. Correct it next cycle.
Frequently Asked Questions
How much inventory should I keep for a festive sale in India?
What is a good safety stock percentage for an ecommerce sale?
Should I hold buffer stock on every SKU during a sale?
How does COD change how much inventory to keep for ecommerce sale periods in India?
How do I decide how much inventory to keep for ecommerce sale events without historical data?