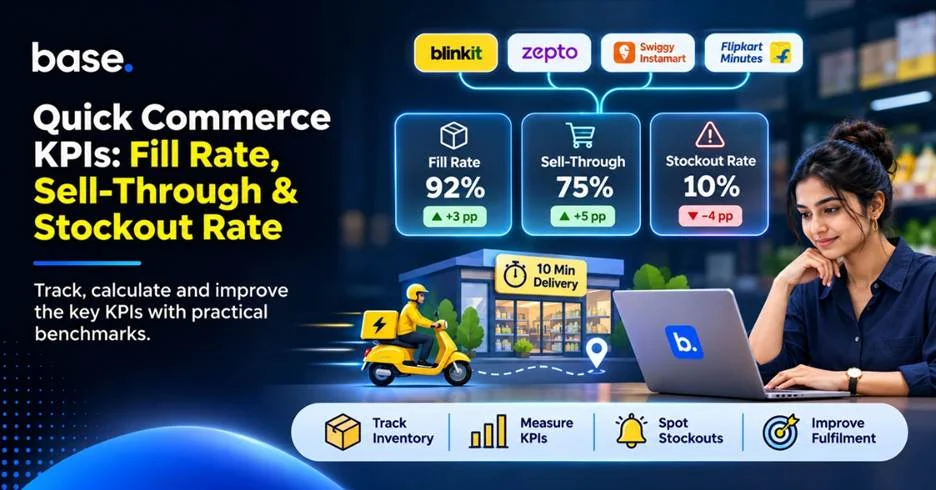
Fill rate, sell-through and stockout rate help brands understand whether they are supplying the right quantities, moving inventory and keeping products available. Fill rate measures the proportion of ordered units supplied; sell-through measures the proportion of received stock sold during a defined period; and stockout rate measures how often an item is unavailable. Track these quick commerce KPIs regularly, using consistent definitions and periods, and compare results with relevant benchmarks rather than assuming one target fits every category.
For brand, category, sales and supply-chain teams, these measures connect customer demand with day-to-day execution. A low fill rate may point to supply constraints, slow sell-through can tie up inventory, and stockouts can mean missed sales. Review performance by SKU, city and fulfilment location so that teams can identify where action is needed.
What is quick commerce?
Quick commerce is a retail format in which customers receive everyday and impulse-purchase goods within a short delivery window. Dark stores hold local inventory so orders can be picked close to customers. With limited shelf space, fast-moving products and frequent replenishment, accurate inventory records are essential.
A national sales or availability figure can hide stockouts at individual locations. Monitor inventory, sales and supply at store level to plan replenishment around local demand.
Quick commerce platforms and the source of your KPI data
Quick commerce platforms may provide reports through seller or brand accounts, account managers or commercial reporting. Access depends on the platform, seller setup and permissions, and the companies listed below do not all publish a shared KPI dashboard or common metric definitions.
| Platform | Where to check KPI data | Public information |
|---|---|---|
| Blinkit | Seller or brand account, account manager and commercial reports. | Blinkit brand information |
| Zepto | Seller or brand account and account manager. | Zepto Brand Partner Portal |
| Swiggy Instamart | Brand account and account manager. | Swiggy Instamart partner page |
| Flipkart Minutes | Where applicable, seller or partner reporting. | Flipkart Minutes announcement |
| Amazon Now | Where possible, seller or programme reporting. | Amazon Now announcement |
The reports available and the way metrics are calculated can vary by platform and supplier agreement. One report may show accepted units, while another may show ordered units or availability observations. Check each platform’s definitions before comparing results, and use your own calculations as a supplement to platform reporting.
To get channel context, see our quick commerce guide.
Quick commerce KPIs every brand should track
| KPI | What it tells you | Simple formula | How often to check |
|---|---|---|---|
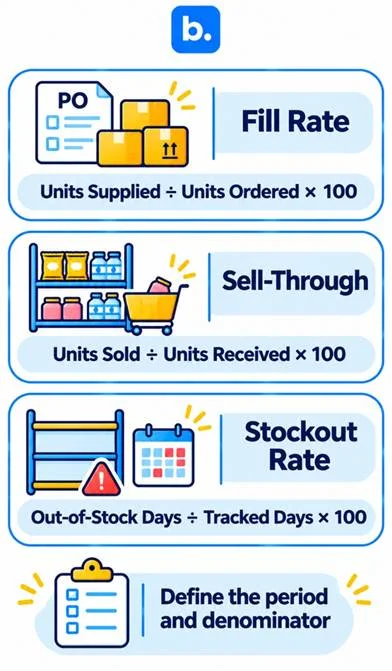
| Fill rate | Share of ordered quantity supplied. | Units supplied ÷ units ordered × 100 | Per order and weekly |
| Sell-through | Share of received inventory sold in a period. | Units sold ÷ units received × 100 | Weekly or monthly |
| Stockout rate | Share of the tracked period when the item was unavailable. | Out-of-stock days ÷ total tracked days × 100 | Daily and weekly |
| Availability | How consistently a product can be purchased. | Available observations ÷ total observations × 100 | Daily |
| Days of cover | How long current stock may last at recent sales. | Available stock ÷ average daily sales | Daily or weekly |
| Sales velocity | How quickly units sell over a defined period. | Units sold ÷ number of days | Daily or weekly |
| Wastage or expiry rate | Share of inventory lost to wastage or expiry. | Units wasted or expired ÷ stated inventory base × 100 | Weekly or monthly |
The formulas below are useful for brand-side analysis. Platforms may use different denominators or reporting periods, so apply each formula consistently and state the inventory base and time window.
Availability measures whether a product can be purchased when checked. Stockout rate measures how often a product is unavailable over a defined period. They are not exact opposites unless they use the same locations, observation points and time periods. Days of cover estimates how long available stock may last at the recent average daily sales rate. Sales velocity measures units sold per time period, such as units per SKU per day.
Fill rate
What it is
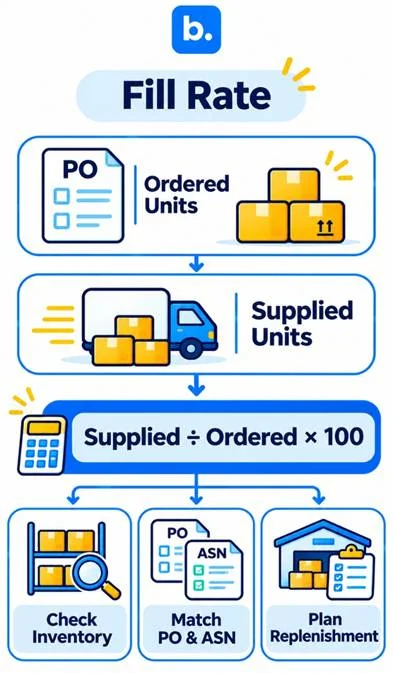
Fill rate is the proportion of ordered units supplied by the brand. This unit-based formula is one way to calculate it; a buyer may instead count order lines or complete orders. Compare like with like by using the same measurement basis.
Formula: Fill rate = (units supplied ÷ units ordered) × 100
Why it matters
- A low score means that the brand failed to provide the entire amount requested.
- Frequent shortages can make replenishment harder and may affect the supplier relationship. Check the platform’s own reporting before drawing conclusions about ranking or product visibility.
How to improve it
- Maintain records of inventory.
- Confirm purchase orders only when the requested quantities can be fulfilled.
- Correlate the ASN and the physical shipment.
- Plan replenishment around demand and supplier lead times.
- Review shortages by SKU and fulfilment location.
For practical reorder planning, combine purchase orders, demand and lead-time information. Check that replenishment quantities can be supplied to each location.
Sell-through
What it is
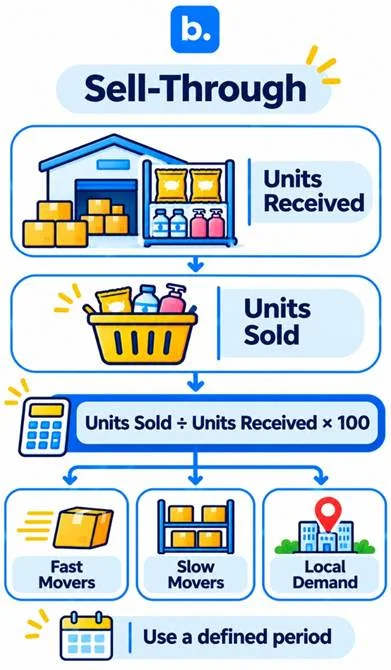
Sell-through measures the share of received inventory sold during a defined period. Calculate it by dividing units sold by units received. Keep the period and denominator consistent, and state whether the result is measured by receipt cohort, SKU or location.
Formula: Sell-through = (units sold ÷ units received) × 100
Why it matters
- It indicates the rate at which inventory is being sold.
- A high score can be a sign of high demand and efficient distribution.
- A low rate may point to surplus inventory, a product-market mismatch or stock allocation that does not reflect local demand.
How to improve it
- Check sales by SKU, city and dark store.
- Determine fast and slow moving products.
- Replenish according to local demand.
- Use sales trends by location to guide allocation rather than sending the same quantity everywhere.
- Check the assortment and pack sizes.
Compare stock distribution by location with local sales trends and replenishment lead times.
Stockout rate
What it is
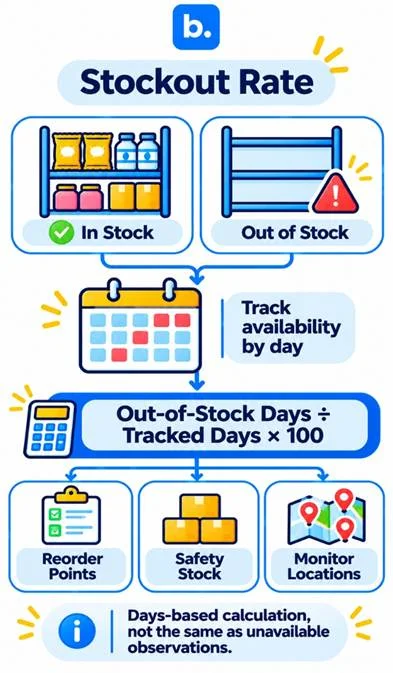
Stockout rate measures how often a product is unavailable during a specified period. The formula below uses days, but a platform may measure availability by hours, inventory observations or availability events. State which method you use.
Formula: Stockout rate = (out-of-stock days ÷ total tracked days) × 100
Why it matters
- Unavailable products cannot make sales during the stockout period.
- Repeated stockouts can interrupt repeat purchases and leave sales opportunities to competing products.
- Check the platform’s own data before concluding that stockouts affect search ranking or product visibility.
How to improve it
- Set reorder points based on demand and supplier lead time.
- Maintain suitable safety stock.
- Monitor inventory by location.
- Determine demand peaks.
- Check replenishment delays and transfer times.
Demand planning can help teams anticipate local needs. Our quick commerce guide provides wider channel context, but reorder decisions should be based on your own SKU- and location-level data.
A worked example: calculating the three KPIs
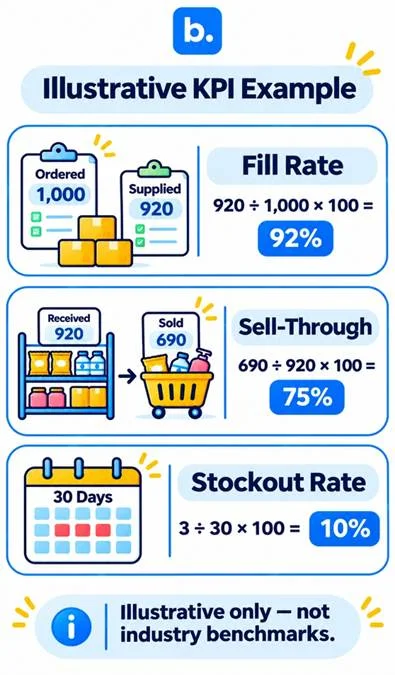
The figures below are illustrative and are not platform benchmarks. Over 30 days, a platform orders 1,000 units, the brand supplies and the platform receives 920, customers buy 690 of those units within 14 days, and the product is unavailable for three days.
| KPI | Inputs | Result | What to do |
|---|---|---|---|
| Fill rate | 920 ÷ 1,000 × 100 | 92% | Investigate why 80 ordered units were not supplied. |
| Sell-through | 690 ÷ 920 × 100 | 75% | Review the remaining 230 units and plan replenishment around demand. |
| Stockout rate | 3 ÷ 30 × 100 | 10% | Find why the product was unavailable for three days. |
Fill rate: 920 ÷ 1,000 = 92%. Sell-through: 690 ÷ 920 = 75%. Stockout rate: 3 ÷ 30 = 10%.
This example shows how to calculate the three measures; it does not establish an industry benchmark. Use the platform’s accepted definitions and state the time window when reviewing actual performance.
Benchmarks: how to use them
Benchmarks vary by platform, category, city and period. The public figures below offer useful context, but they measure different aspects of quick commerce operations. Treat each one according to its scope: HUL’s fill-rate improvement is company-specific, Bernstein’s availability study covers a defined sample of products and locations, and Gury’s inventory-cover guidance is an operational recommendation rather than a universal target.
| KPI | Benchmark found | Source and date | Category or platform |
|---|---|---|---|
| Fill rate | HUL reported that an AI-led availability engine improved customer-reported fill rate by 1,400 basis points to above 90%. This is a company-specific result, not a universal target. | Unilever Investor Event 2026 transcript | HUL quick commerce operations. |
| Availability | Blinkit: 94.4%; Flipkart Minutes: 88.7%; Swiggy Instamart: 83.8%; Zepto: 82.5% average in-stock rates in the study. | Bernstein study reported by Entrackr | 150 SKUs across grocery, fresh and non-grocery categories. |
| Days of cover | 10–14 days of forward inventory cover is suggested for mother warehouses, with seven days cited as a minimum. This is operational guidance, not a universal target. | Gury Quick Commerce Operations Playbook | FMCG and D2C operational guidance in India. |
The Bernstein figures measure product availability at the time of observation. They should not be presented as a stockout rate based on days out of stock. Gury’s days-of-cover guidance applies to mother-warehouse inventory and should not be treated as a target for every dark store or fulfilment location.
Avoid adopting a fill-rate or sell-through target simply because it appears in an unrelated article. Establish your own baseline using consistent calculations, then set targets by SKU, category, city and fulfilment location. Review those targets as demand and operating conditions change.
How to track KPIs in practice
Pull reports at a consistent time and keep a record for each platform. Where the data is available, track results by SKU, city and dark store. Record stockouts, rejected shipments and replenishment delays, and use consistent reporting periods. Assign an owner to each KPI and review the actions taken during operations meetings.
| Cadence | What to review | Suggested owner |
|---|---|---|
| Daily | Availability, stockouts, urgent replenishment and order shortages. | Inventory or supply chain team. |
| Weekly | Fill rate, sell-through, sales velocity, days of cover and store-level performance. | Category or operations team. |
| Monthly | KPI trends, wastage, expiry, assortment and target revisions. | Category, finance or business head |
Keep the source report, formula and KPI owner with each result. Record any changes to platform definitions or reporting periods so that historical comparisons remain meaningful.
How Base OMS helps track quick commerce KPIs
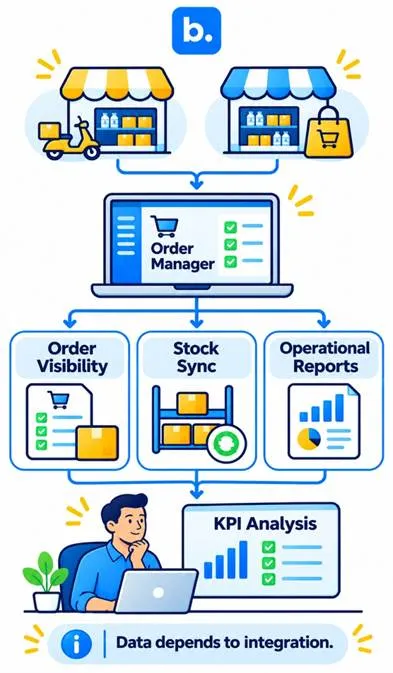
Orders: Our Order Manager gives you visibility into the orders made by the sales channels linked to Base. Supported workflows allow teams to review available order details and process orders. The information and actions available depend on the channel connection.
Stock: Our platform facilitates stock synchronisation in supported integrations. The stock data accessible by SKU or location is based on the linked channel and setup. When evaluating a particular fulfilment location, use the underlying channel records.
Reports: Order Manager provides reports and printouts for supported operations. These can help teams review order and stock activity and investigate operational issues. Base does not automatically calculate platform-specific fill rate, sell-through or stockout benchmarks. Book a demo to review the workflows available for your connected channels.
Conclusion
Fill rate indicates how reliably a brand supplies ordered quantities, sell-through shows how quickly received inventory moves, and stockout rate highlights gaps in availability. Calculate each measure consistently, record its denominator and time period, and compare like with like. Use the results to identify SKU- and location-level actions, assign owners and review progress regularly. Base Order Manager can provide order and stock visibility across supported connected channels.