In the Indian retail ecosystem, one demand forecasting miss can decide the fate of an entire festive season. Get it right, and inventory flies off shelves. Get it wrong, and you’re staring at warehouses full of dead stock by year-end.

Industry data paints a stark picture: nearly 65% of mid-sized Indian businesses lose over 15% of annual revenue not because demand doesn’t exist, but because their supply chains fail to keep up with how fast that demand shifts.
In India, demand forecasting is uniquely unforgiving.
A 10% swing in temperature can dramatically alter apparel and FMCG demand. A one-week shift in the Diwali calendar can move sales peaks by as much as 40%. Add flash sales, regional festivals, influencer-led spikes, and platform-driven demand surges, and suddenly, “gut feeling” stops being intuition and starts becoming risk.
Yet, many sellers still plan inventory the same way they did at ₹5 Cr in GMV, based on last year’s numbers, manual adjustments, and optimism.
For Indian sellers, the challenge runs deeper than demand volatility. High Cash-on-Delivery (COD) return rates, inconsistent last-mile performance, and extreme regional seasonality make demand forecasting a high-stakes operational game. When your data is incomplete or fragmented, you’re not just missing trends, you’re actively eroding margins.
Overstocking leads to high carrying costs, forced discounting, and cash locked in slow-moving SKUs. Understocking means missed peak sales, rising acquisition costs, and frustrated customers who don’t come back.
This is the silent killer of profitability.
Demand forecasting failures rarely come from a single bad assumption. They come from data gaps, missing signals your systems never captured or your teams never connected.
The guide ahead breaks down the top 10 critical data gaps that derail demand forecasting for Indian retailers and shows how to close them with smarter inputs, tighter feedback loops, and planning models built for India’s realities.
1. The Disconnect of Data Silos
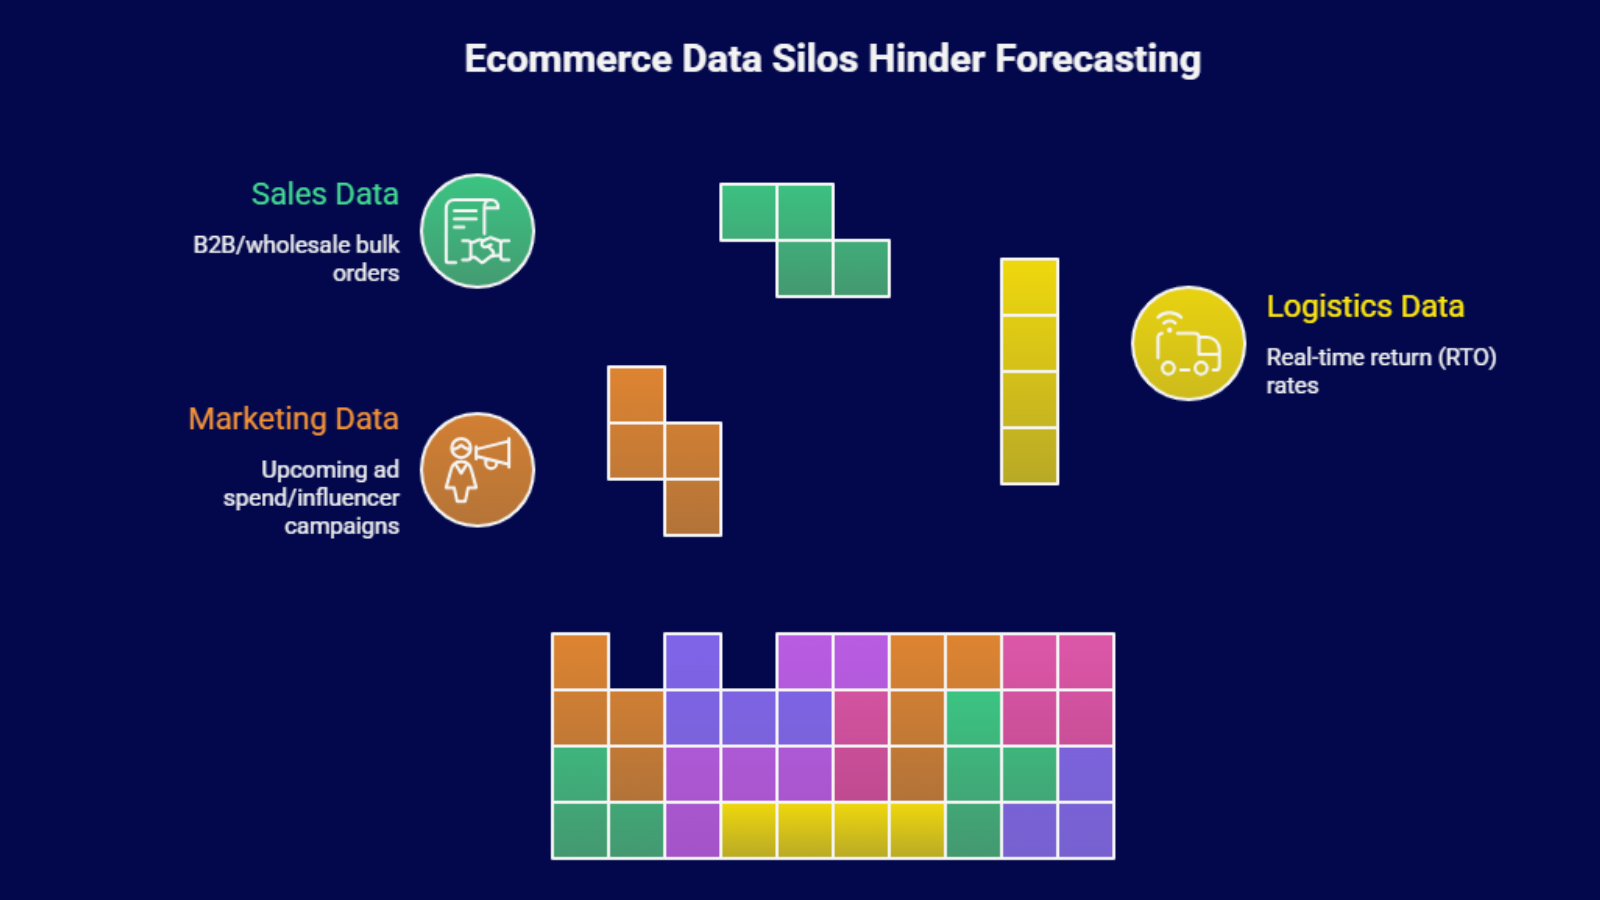
In most Indian ecommerce setups, information is trapped in departmental pockets. The marketing team runs a massive influencer campaign on Instagram, but the inventory manager only sees the historical sales from the previous month. This lack of communication creates data silos, preventing a unified view of the business.
When your sales data from Shopify, marketplace data from Amazon, and marketing spend on Meta ads don’t talk to each other, your forecast is essentially blind. In a market as volatile as India, where “going viral” can happen in hours, siloed data leads to massive demand planning errors.
| Department | Data Type Often Siloed | Impact on Forecasting |
|---|---|---|
| Marketing | Upcoming Ad Spend/Influencer Campaigns | Sudden demand spikes that look like “anomalies” |
| Logistics | Real-time Return (RTO) rates | Overestimating actual sold units vs. shipped units |
| Sales | B2B/Wholesale bulk orders | Skewed daily velocity averages |
2. Ignoring the “RTO” Factor in Net Demand
Indian sellers face a unique challenge: Cash-on-Delivery (COD). High COD volumes often lead to high Return-to-Origin (RTO) rates, sometimes reaching up to 30% in categories like fashion. Most forecasting models focus on “Gross Orders,” but failing to account for the gap between an order placed and an order delivered is a major pitfall.
If your demand forecasting model doesn’t deduct predicted RTOs from your demand signal, you will consistently over-order stock. This creates an artificial “sales” high that never translates into revenue, leading to severe sales forecasting issues and tied-up capital.
- Regional RTO Variance: Data gaps often exist in understanding that a sale in Bihar might have a higher RTO probability than one in Karnataka.
- Product-Level Returns: Specific SKUs might have higher return rates due to fitment issues, which historical “total sales” data won’t show.
3. The “Moving Festival” Data Gap
Unlike Western markets where Christmas is always December 25th, India’s major demand drivers, Diwali, Eid, and Raksha Bandhan, follow lunar or traditional calendars. If your forecasting model is built on simple year-on-year (YoY) monthly comparisons, you will miss the mark.
For example, if Diwali moves from October in Year 1 to November in Year 2, a standard monthly forecast will show a “massive dip” in October sales that doesn’t actually exist. Accurate demand forecasting requires “event-based” data overlays rather than just chronological data.
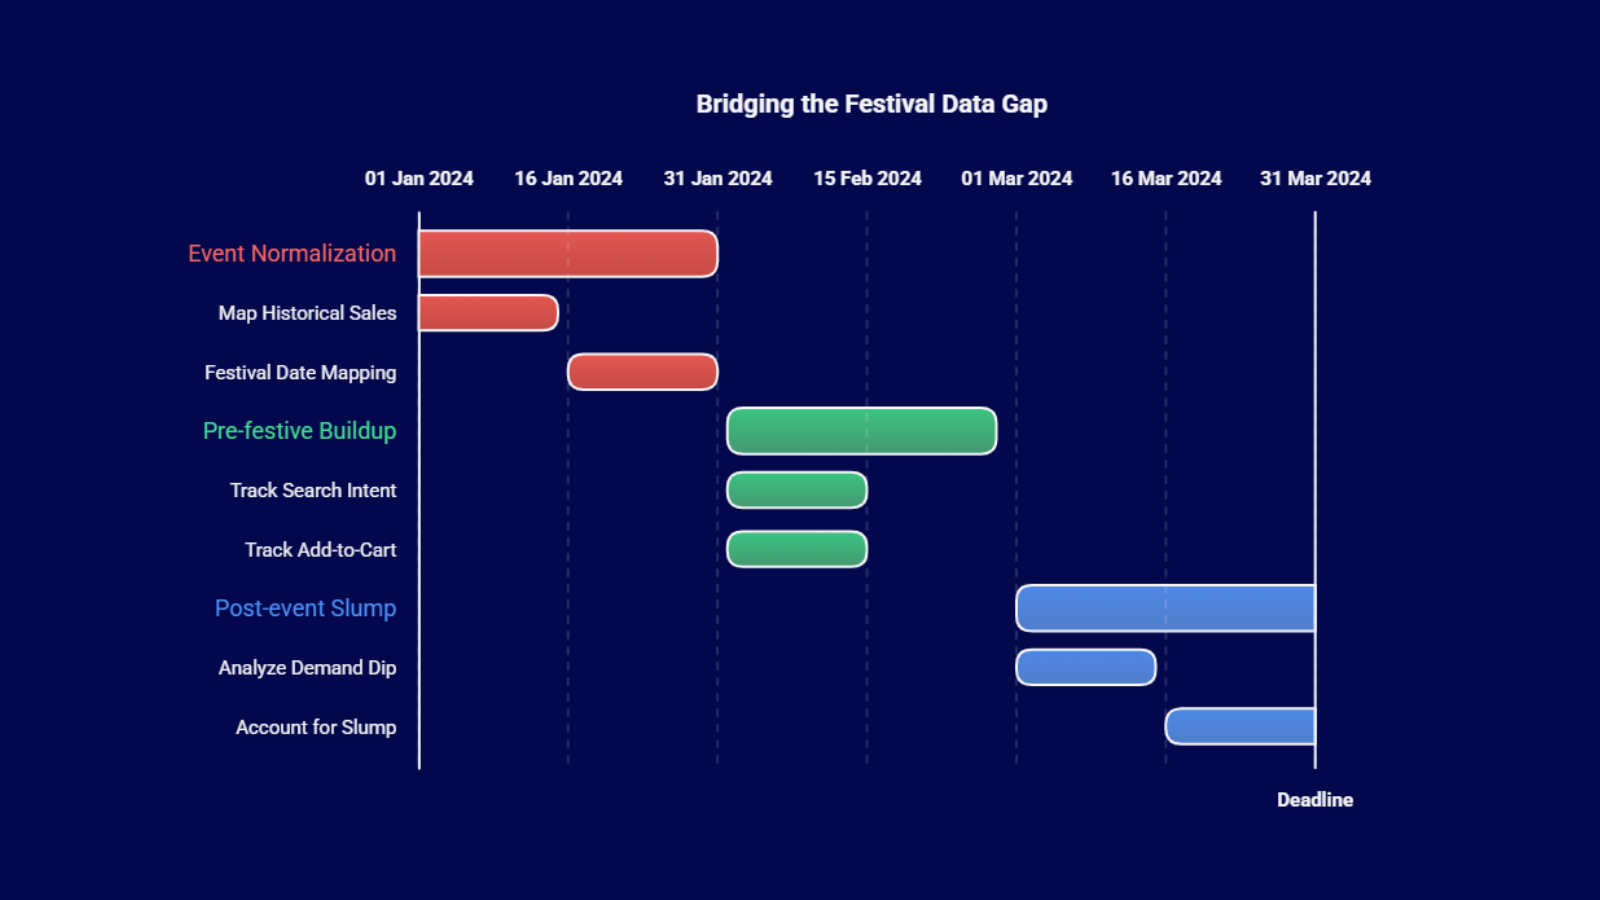
Strategies to Bridge the Festival Gap:
- Event Normalization: Map historical sales to the specific festival date rather than the calendar month.
- Pre-festive Buildup Data: Track the “search intent” and “add-to-cart” behavior 15 days prior to the event.
- Post-event Slump Analysis: Account for the inevitable dip in demand that follows the high-spending festive weeks.
4. Lack of Granular SKU-Level Visibility
In the Indian consumer market, demand is rarely uniform across a product line. A common mistake among sellers is forecasting at the category level, such as “Men’s Formal Shirts”, rather than at the SKU level. This creates a massive data gap because specific attributes like size, color, and fabric type have vastly different turnover rates across different Indian cities.
When you aggregate data, you wash out the nuances of consumer preference. For example, smaller sizes might sell out instantly in Northeast India, while larger sizes remain on shelves. If your demand forecasting model does not account for “Stockout Days” at the SKU level, it will record a drop in sales as a drop in demand. In reality, the demand was there, but the product was not. This leads to a perpetual cycle of under-ordering your bestsellers and over-ordering your slow-movers.
SKU Performance Metrics to Track
- Size-Curve Analysis: Understanding the distribution of sizes sold per region to avoid local stockouts.
- Color Popularity Index: Tracking how specific shades perform during different seasons, such as bright colors during Holi.
- Lost Sales Contribution: Estimating how much revenue was missed due to a specific SKU being unavailable.
5. Regional and Climatic Data Omissions
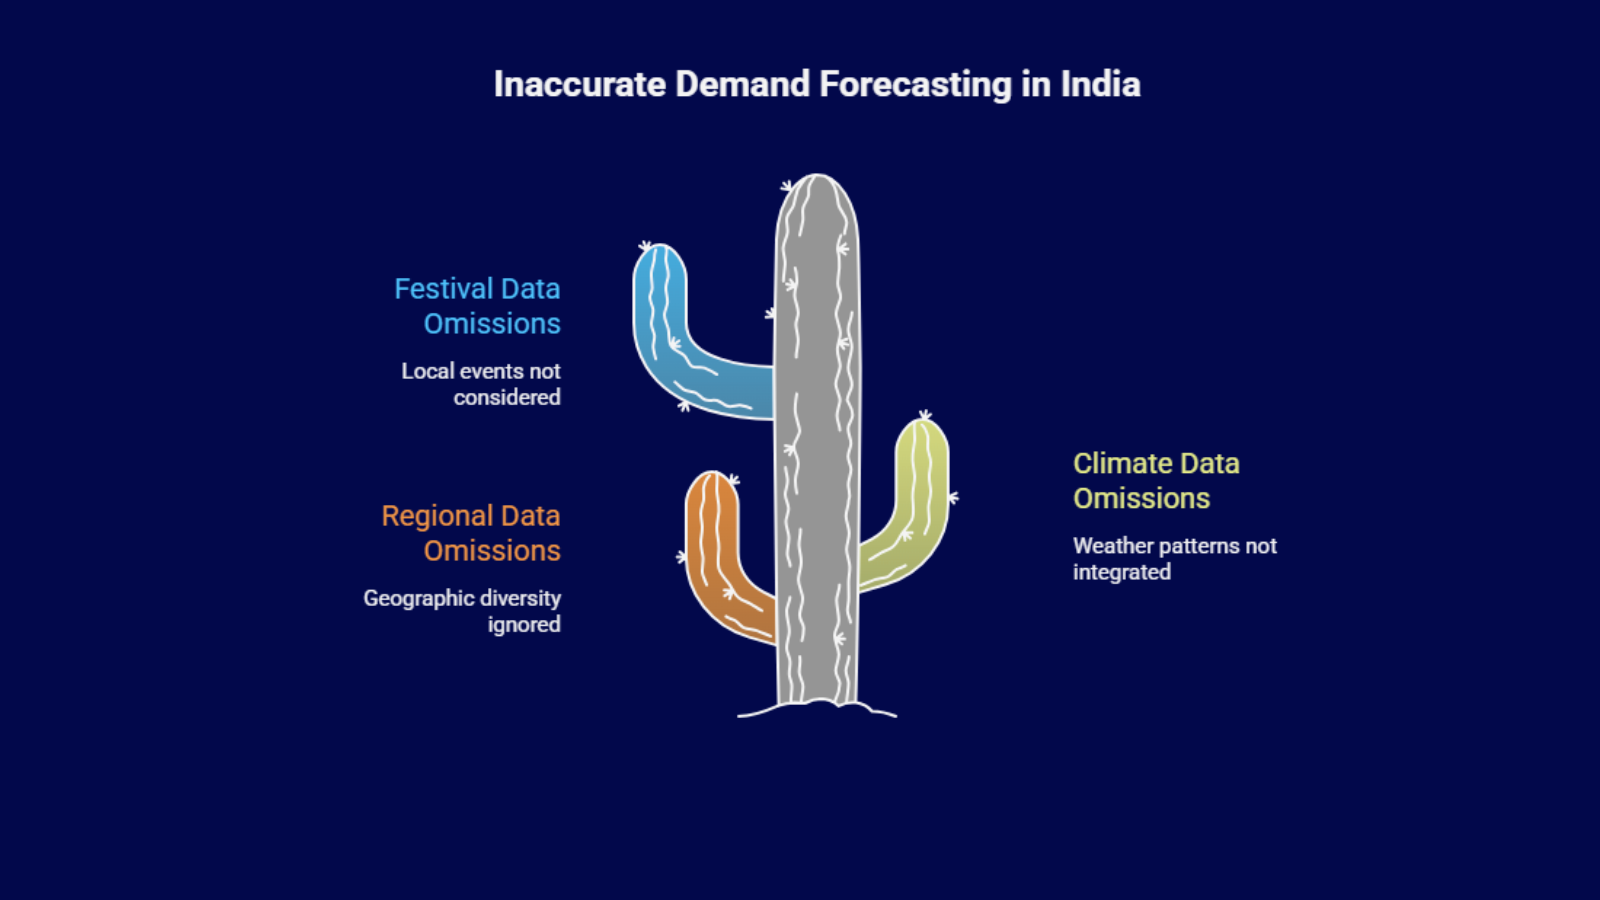
India’s geographic diversity means that “winter” in Delhi is vastly different from “winter” in Bangalore. A significant demand forecasting gap occurs when sellers fail to integrate climate and regional data into their planning. If a heatwave hits North India earlier than expected, the demand for summer apparel and cooling appliances shifts forward by weeks.
Without regional data hooks, your national-level forecast will be inaccurate. By the time your warehouse in Maharashtra realizes there is a surge in Punjab, the window of opportunity has often closed. Sellers must bridge this gap by mapping their sales data against regional weather patterns and local harvesting seasons, which dictate the purchasing power of rural and semi-urban populations.
Regional Data Impact Table
| Region | Climate/Event Factor | Product Demand Shift |
|---|---|---|
| North India | Extreme Temperature Variance | High volatility in seasonal wear and HVAC |
| South India | Extended Monsoon Cycles | Increased demand for waterproof gear and anti-fungal care |
| West India | Major Regional Festivals (Ganesh Chaturthi) | Spikes in ethnic wear and gifting categories |
6. Underestimating Shadow Demand from Competitors
Your sales figures do not exist in a vacuum. In highly competitive marketplaces like Amazon India or Flipkart, your demand is often a reflection of your competitor’s failures. If a top-ranking competitor goes out of stock or hikes their prices, their customers will migrate to your listing. This is known as “Shadow Demand.”
The gap arises when sellers interpret this temporary surge as a permanent growth trend for their own brand. If you don’t track competitor stock status, you might place a massive replenishment order just as your competitor comes back in stock with a heavy discount. This leads to significant demand planning errors where you are left holding excess inventory that was only “in demand” due to a temporary market vacancy.
How to Monitor Shadow Demand
- Competitor Stock-Out Tracking: Notating when key rivals are unavailable to explain sudden sales spikes.
- Pricing Correlation: Analyzing how your sales velocity changes when a competitor changes their price point by even 5%.
- Share of Voice (SOV): Measuring how often your product appears in top search results compared to others.
7. The Lag in Real-Time Inventory Updates
In the fast-paced world of Indian quick-commerce and marketplace selling, data that is 24 hours old is already obsolete. Many businesses suffer from sales forecasting issues because their systems rely on batch processing rather than real-time inventory updates. If your inventory levels and sales velocity are not synced every hour, your demand forecasting model is essentially driving by looking at the rearview mirror.
This lag is particularly dangerous during flash sales or pay-day weekends. When demand spikes, a delayed data feed might show that you have plenty of stock, preventing your system from triggering a “low stock” alert. By the time the data refreshes, you have oversold, leading to cancellations, negative reviews, and a drop in your marketplace seller rating.
- Overselling: Accepting orders for products that are already physically sold out in the warehouse.
- Safety Stock Depletion: Failing to realize that your buffer stock is being eaten away faster than anticipated.
- Inaccurate Lead Times: Being unable to give customers a realistic delivery date due to inventory uncertainty.
8. Poor Tracking of Marketing Attribution
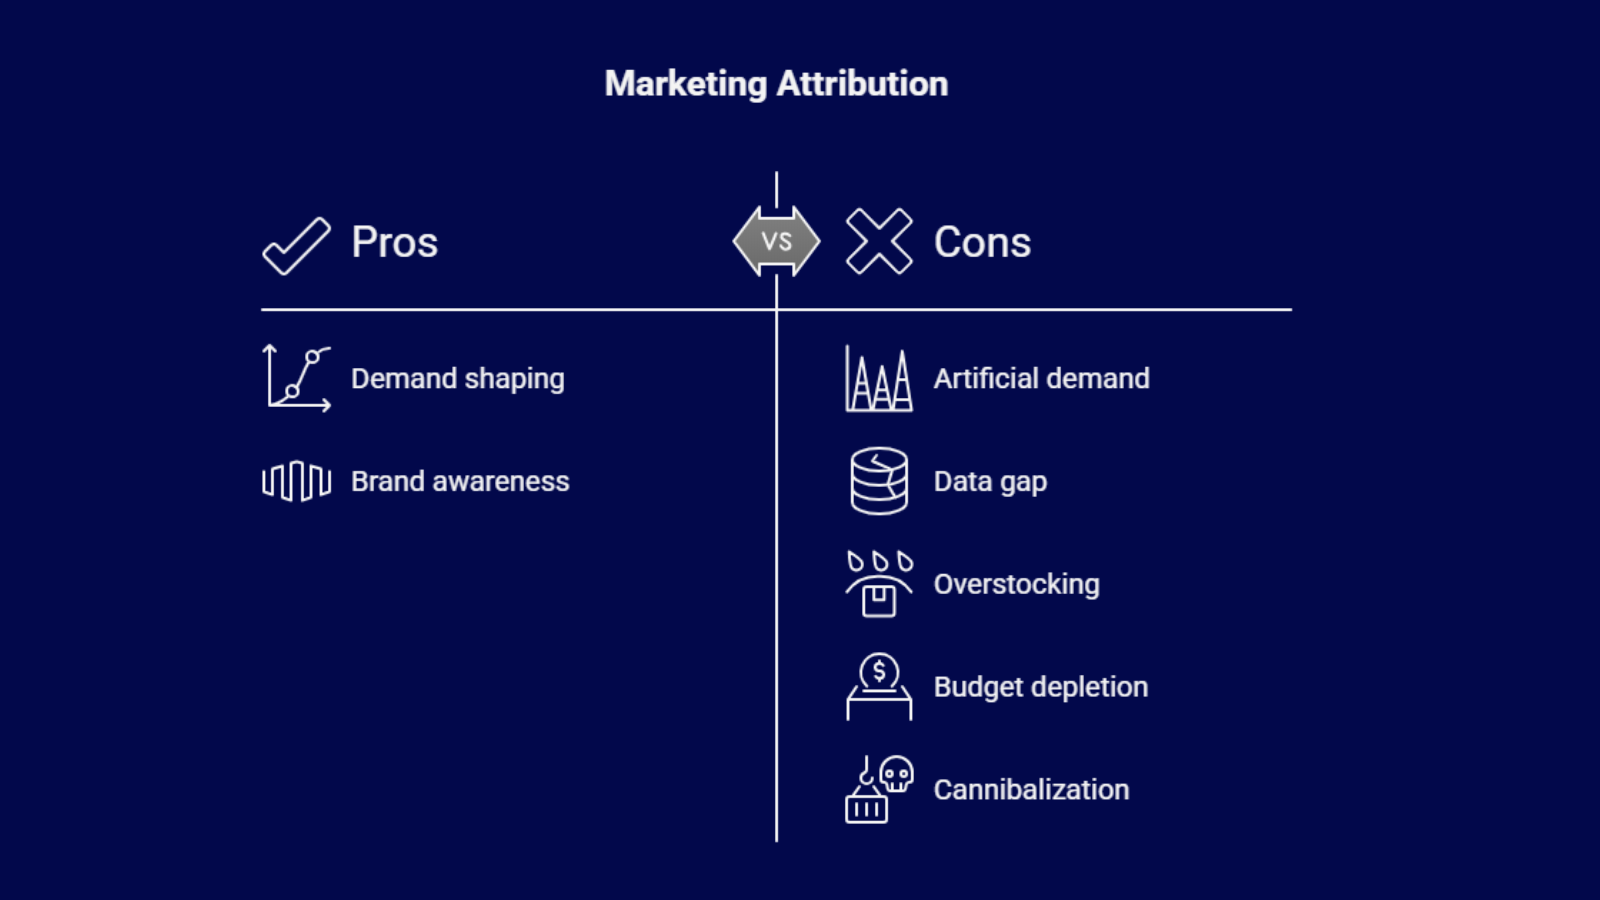
Marketing spend is the primary lever for demand shaping. However, many B2B and D2C brands in India have a disconnect between their performance marketing data and their inventory planning. If you run a high-budget campaign with a popular influencer, the resulting demand spike is “artificial” and will not repeat once the campaign ends.
The data gap occurs when this promotional lift is blended into the baseline demand. If your demand forecasting software sees a 300% growth in June due to a one-time ad spend, it will predict a similar trend for July. Without separating “Organic Demand” from “Promotional Demand,” you will end up with a warehouse full of inventory and no ad budget left to move it.
- Baseline Sales: The natural velocity of your product without any active marketing spend.
- Promotional Lift: The specific percentage increase in sales directly tied to a discount or ad campaign.
- Cannibalization Data: Tracking if a promotion on “Product A” actually stole sales from your own “Product B.”
9. Neglecting Logistics and Lead Time Variability
For an Indian seller, the “Lead Time” is rarely a fixed number. Between port delays, interstate border checks, and local festival holidays, a shipment that usually takes 10 days could easily take 20. A major gap in demand planning is treating lead time as a constant variable in the demand forecasting equation.
If your data does not include “Supplier Variability,” your Reorder Point (ROP) will always be wrong. You might forecast the demand perfectly, but if the stock arrives 5 days late, you still face a stockout. High-performing sellers track the actual historical performance of their suppliers and logistics partners to build a “buffer” that reflects reality rather than the contract terms.
Logistics Data Points to Monitor
- Transit Time Variance: The difference between the promised delivery date and the actual arrival date.
- Inbound Quality Rates: How much of the incoming stock is actually sellable vs. damaged.
- Last-Mile Latency: Regional delays in specific zones that might affect the “Net Demand” in those areas.
10. Qualitative Feedback Omissions
Data-driven demand forecasting often fails because it ignores the human element. Qualitative data, such as customer complaints, social media sentiment, and feedback from your sales team, often acts as a leading indicator for demand shifts. If customers are starting to complain about a specific trend going out of style, that sentiment will show up in your feedback loops long before it shows up as a dip in your sales charts.
In India, where trends move at the speed of social media, ignoring these qualitative signals creates a dangerous blind spot. Integrating “Voice of Customer” data into your demand forecasting allows you to be proactive. If a product has a high return rate due to a specific defect, you can pause replenishment immediately rather than waiting for the monthly sales report to tell you there is a problem.
Integrating Qualitative Insights
- Sentiment Scoring: Using AI to categorize customer reviews as positive, neutral, or negative to predict future demand.
- Returns Analysis: Deep-diving into “Reason for Return” codes to identify if demand is falling due to quality issues.
- Sales Team Debriefs: Capturing on-ground insights from B2B distributors who see market shifts firsthand.
Summarizing the Impact of Data Gaps
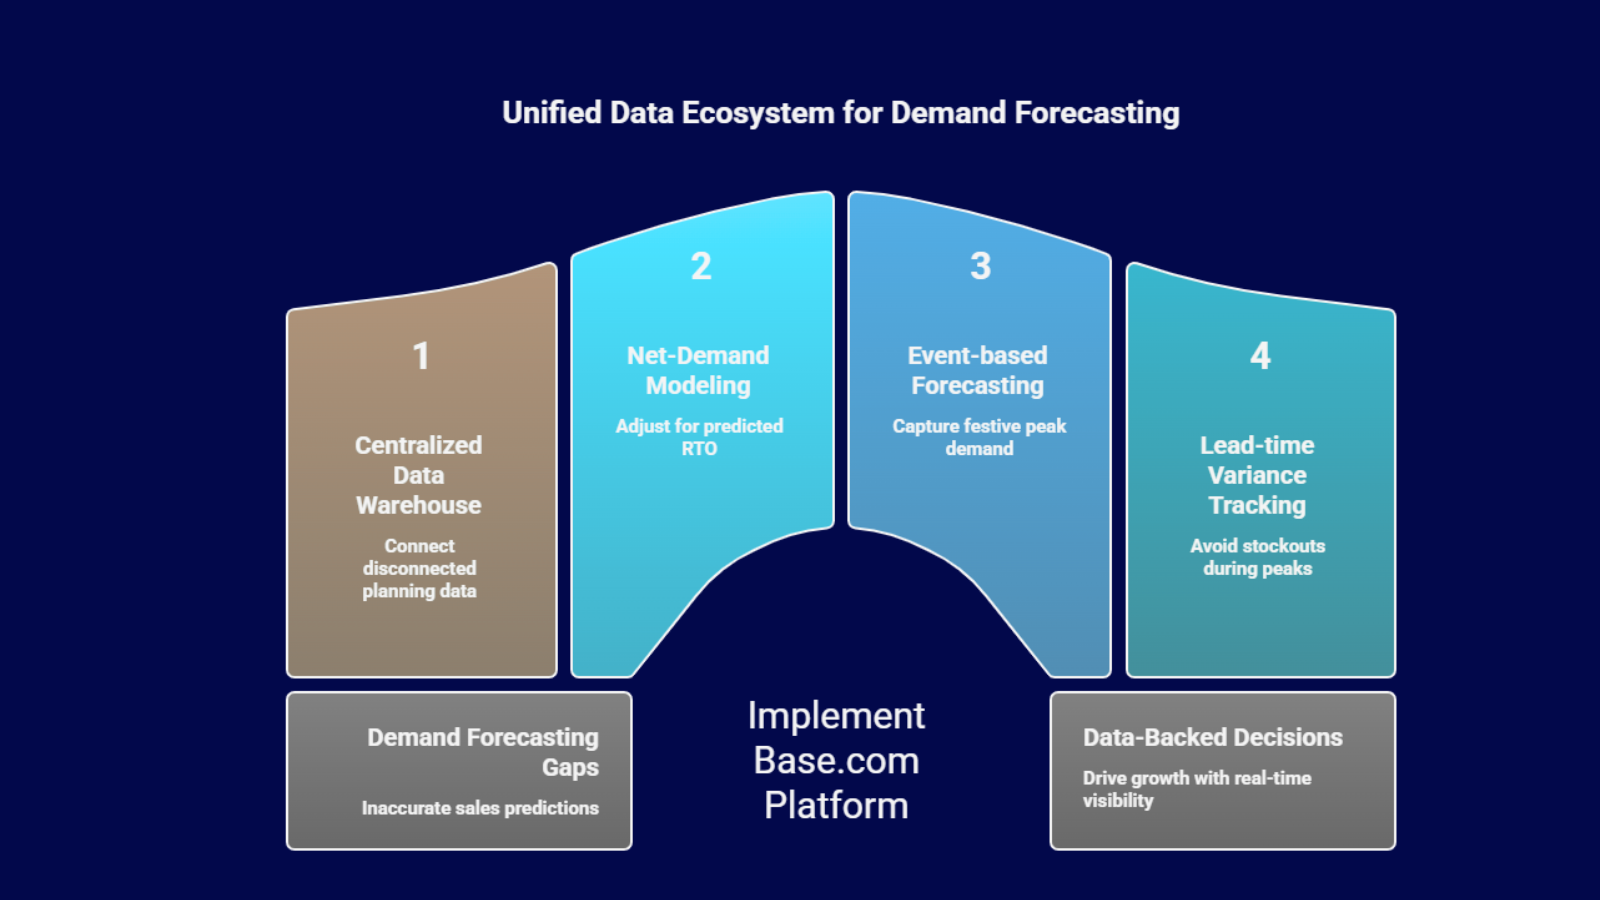
Bridging these demand forecasting gaps requires more than just spreadsheets; it requires a unified data ecosystem. If you are struggling with data silos or recurring sales forecasting issues, it’s time to move to a platform designed for the complexities of the Indian market.
| Data Gap | Primary Impact | Recommended Fix |
|---|---|---|
| Data Silos | Disconnected Planning | Centralized Data Warehouse (like Base.com) |
| RTO Exclusion | Overstocking/Dead Stock | Net-Demand Modeling (Gross – Predicted RTO) |
| Fixed Calendars | Missing Festive Peaks | Event-based forecasting models |
| No Lead-Time Data | Stockouts during peaks | Lead-time variance tracking |
Base.com provides the real-time visibility and cross-channel integration needed to eliminate demand planning errors once and for all. From tracking RTO-adjusted demand to managing multi-channel inventory, Base.com empowers you to make data-backed decisions that drive growth.
Click here to read more about the future of shipments in Tier 2 and 3 India.
Frequently Asked Questions (FAQs)
1. How do data silos specifically affect my profit margins?
Data silos prevent different teams from seeing the “full picture.” For example, marketing might promote a product that is nearly out of stock, leading to wasted ad spend and poor customer experience, which directly lowers your overall ROI and margins.
2. Why is historical data not enough for Indian ecommerce forecasting?
India is a rapidly evolving market with shifting festival dates and high price sensitivity. Historical data only shows past patterns; it cannot account for new competitor entries, sudden viral trends, or the specific timing of the “Big Billion Days” each year.
3. What is the most common demand planning error for new D2C brands?
The most common error is failing to account for the “Initial Hype” vs. “Sustainable Demand.” New brands often over-order after a successful launch month, not realizing that early demand was driven by curiosity and heavy initial marketing rather than repeat behavior.
4. How can I account for regional weather in my demand forecast?
You can use API integrations from weather services to overlay temperature and rainfall data with your regional sales. This helps you understand, for example, why “Sunscreen” sales might be spiking in Mumbai while remaining flat in Delhi during the same week.
5. How does RTO data change my inventory purchasing decisions?
By tracking RTO rates by category and region, you can calculate your “Real Sales Velocity.” This ensures you only order enough replacement stock for items that actually stay with the customer, preventing your capital from being locked in returned, unsellable inventory.