If you run a D2C brand in India, inventory decides how fast you grow. It controls your cash flow, your ad scaling, and even your ability to launch new products. Yet most founders focus on revenue while ignoring how quickly their stock actually moves. That is where problems begin.
Many Indian D2C brands operate at just 2 to 3 inventory turns per year. That means inventory sits for 120 to 180 days. During that time, warehousing costs add up, RTO rates eat margins, and cash remains blocked in unsold stock. On the other hand, stocking too little creates frequent stockouts and missed sales.
The right balance is critical. Understanding the ideal inventory turns for D2C brands helps you protect margins, stabilize cash cycles, and scale without relying on heavy discounts. In this blog, we will break down the exact benchmarks, Indian market realities, and practical numbers you need to track.
What Are Inventory Turns and Why Do They Matter
Inventory turns show how many times you sell and replace stock in a year. The formula is simple:
Inventory Turnover = Cost of Goods Sold ÷ Average Inventory
If an Indian apparel brand has ₹6 crore COGS and ₹1 crore average inventory, its turnover is 6. That means stock rotates every 60 days.
Now consider a real scenario.
A Gurgaon-based D2C fashion brand operating at 3 turns per year holds inventory for 120 days. With warehousing at ₹25 per sq ft, 30 percent COD orders, and 25 percent RTO in Tier 2 cities, cash remains blocked for four months. They end up running 20 percent discounts to clear aging SKUs.
At 6 to 8 turns, inventory moves every 45 to 60 days. Dead stock stays under 10 percent. Cash cycles stabilize.
This is why inventory turns directly affect D2C inventory metrics like days inventory outstanding, sell-through rate, and working capital efficiency.
What Is the Ideal Inventory Turns for D2C Brands?
The ideal inventory turns for D2C brands depend on category, margin profile, and lead time. However, Indian e-commerce data shows clear performance bands.
| Category | Ideal Inventory Turns Per Year | Avg Days in Inventory | Key Risk if Below Range |
|---|---|---|---|
| Apparel | 5 to 7 | 50 to 70 days | Heavy discounting post-season |
| Beauty and Skincare | 6 to 9 | 40 to 60 days | Expiry and batch aging |
| Consumables | 8 to 12 | 30 to 45 days | Stockouts and repeat loss |
| Electronics | 3 to 5 | 70 to 100 days | Price depreciation |
| Home Decor | 3 to 5 | 75 to 110 days | Slow SKU buildup |
For most Indian D2C brands, 5 to 8 turns per year is healthy. That means stock rotates every 45 to 75 days.
Below 3 turns signals overbuying and blocked cash. Above 12 turns often means understocking and lost sales. Both distort inventory turns D2C and weaken core D2C inventory metrics like sell-through and days inventory outstanding.
Key D2C Inventory Metrics to Track Alongside Inventory Turns
Tracking the ideal inventory turns for D2C brands gives you a speed number. But speed without depth is risky. Inventory turns D2C tells you how fast stock rotates. These five D2C inventory metrics tell you whether that rotation is profitable, stable, and scalable. Each metric below is practical and measurable for Indian D2C brands.
1. Gross Margin Return on Inventory Investment
 GMROI shows how efficiently your inventory generates profit.
Formula: Gross Profit ÷ Average Inventory Cost
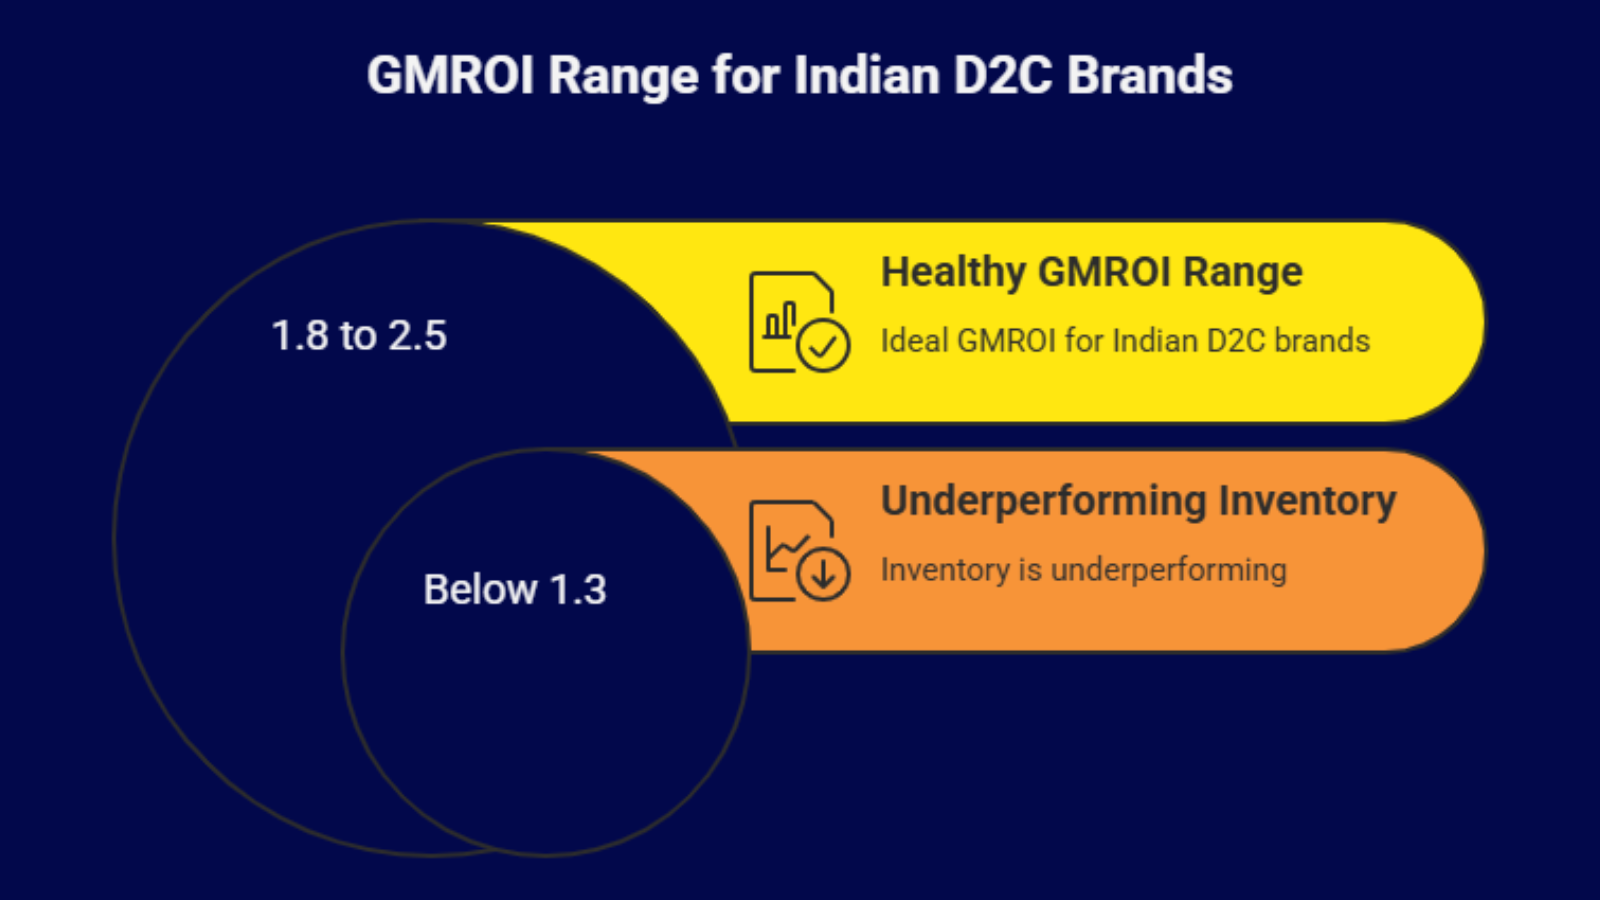
If your gross profit is ₹2.4 crore and average inventory holding is ₹1.2 crore, your GMROI is 2. That means every ₹1 locked in stock generates ₹2 in gross profit.
For Indian D2C brands, a healthy GMROI range is 1.8 to 2.5.
If it drops below 1.3, inventory is underperforming.
Actionable fix:
- Reduce buying depth on SKUs with low contribution margin.
- Negotiate staggered production instead of bulk manufacturing.
- Increase price discipline instead of heavy discounting.
This directly strengthens ideal inventory turns for D2C brands.
2. SKU Velocity Contribution
Not all SKUs deserve equal inventory allocation. SKU velocity measures how quickly each product converts stock into revenue.
Metric: Monthly SKU Revenue ÷ Average Units Held
Specific benchmark: If 25 percent of SKUs generate 70 percent of revenue, bottom SKUs must not hold more than 20 percent of inventory value.
Actionable rule:
- Remove SKUs contributing less than 3 percent of revenue for three consecutive months.
- Convert slow variants into limited stock runs.
- Focus procurement budgets on the top 30 percent revenue drivers.
This improves inventory turns D2C without aggressive discounting.
3. Inventory Aging Distribution
Aging analysis is one of the most ignored D2C inventory metrics in India.
Break inventory into buckets:
- 0 to 30 days
- 31 to 60 days
- 61 to 90 days
- 90+ days
Healthy structure for Indian D2C brands:
- Less than 50 percent stock in 0 to 30 days
- Less than 25 percent in 31 to 60 days
- Less than 15 percent in 61 to 90 days
- Under 10 to 12 percent in 90+ days
If 90+ days of stock crosses 15 percent, freeze fresh procurement for that SKU until clearance. Aging inventory damages ideal inventory turns for D2C brands faster than slow sales alone.
4. Supplier Lead Time Variance
 Inventory instability often comes from supplier inconsistency.
Track: Promised Lead Time vs Actual Delivery Time
If the promised lead time is 28 days but the actual delivery averages 40 days, your reorder planning is misaligned.
Specific threshold: If variance exceeds 20 percent consistently, increase safety stock by 7 to 10 days only for high velocity SKUs. Avoid increasing buffers across all products.
Controlled lead time management stabilizes inventory turns D2C and prevents artificial stockouts.
5. Return Recovery Efficiency
Returns are a major distortion factor in Indian D2C, especially with 20 to 35 percent RTO in COD categories.
Measure: Sellable returns restocked within 48 hours ÷ Total sellable returns received
Healthy recovery rate: Above 85 percent.
If restock delays exceed 3 to 5 days, available inventory appears lower than actual. That triggers unnecessary reordering and disrupts D2C inventory metrics.
Actionable steps:
- Set a 48-hour SLA for warehouse inspection.
- Separate damaged vs resellable SKUs immediately.
- Track return reasons SKU-wise to reduce repeat returns.
When these five D2C inventory metrics are tracked monthly, the ideal inventory turns for D2C brands become predictable. Inventory turns D2C without these supporting numbers can look healthy on paper, but fail in cash flow reality. The goal is not just faster rotation. The goal is controlled, profitable rotation backed by measurable data.
How Inventory Turns Vary Based on Own Manufacturing, Single Supplier, or Multiple Suppliers with Different Lead Times
 Inventory turns are deeply influenced by a brand’s manufacturing structure. The faster a brand can replenish stock in line with demand, the healthier its cash flow. Whether a brand owns its plant, depends on a single supplier, or manages multiple suppliers significantly changes how quickly inventory moves and how long cash remains blocked.
Brands with their own manufacturing plants have the highest operational control. They can adjust production schedules, reduce batch sizes, and respond quickly to demand spikes or slowdowns.
This flexibility usually leads to faster and more stable inventory turns because replenishment cycles can be shortened. Although fixed costs are higher, the brand can align output closely with sales velocity, reducing excess stock and minimizing cash lock-in periods.
Brands dependent on a single external supplier operate with moderate risk and moderate predictability. Since production is outsourced to one vendor, lead times are fixed and often range between 45–90 days. MOQ requirements may force bulk ordering, which increases upfront cash outflow.
However, compared to multiple suppliers, coordination is simpler. The key risk lies in dependency, if the supplier faces delays, quality issues, or capacity constraints, the brand’s entire inventory cycle slows down. Inventory turns in this model are stable only if forecasting accuracy is strong and supplier reliability is consistent.
Brands working with multiple suppliers with varying lead times face the highest complexity. Different SKUs may have different production and shipping timelines, which creates uneven replenishment cycles.
Even if some products sell fast, delays in others can disrupt assortment balance. This fragmentation increases forecasting difficulty and often stretches the overall cash conversion cycle, leading to slower and inconsistent inventory turns.
| Factor | Own Manufacturing Plant | Single Supplier | Multiple Suppliers (Varying Lead Times) |
|---|---|---|---|
| Production Control | Full control | Limited to supplier capacity | Fragmented across vendors |
| Lead Time | Adjustable / shorter | Fixed (45–90 days typical) | Highly variable (30–120+ days) |
| MOQ Pressure | Flexible | Often high | Varies by supplier |
| Forecast Dependency | Moderate | High | Very high |
| Inventory Turn Stability | High | Moderate | Low / inconsistent |
| Supplier Risk | Low | High (single point of failure) | Medium (distributed risk) |
| Cash Flow Predictability | High | Moderate | Low |
How Inventory Turns Impact Profitability
 The ideal inventory turns for D2C brands directly influence margin control, cash flow stability, and growth predictability. A single example makes this practical.
Consider a Bengaluru-based D2C apparel brand generating ₹12 crore in annual revenue with 58 percent gross margin. Its average inventory holding is ₹2 crore.
If the brand operates at 3 inventory turns per year, stock sits for roughly 120 days. Carrying costs, including warehousing, handling, and capital cost add nearly 5 percent annually. More critically, seasonal collections age fast.
If ₹60 lakh worth of inventory crosses 120 days and is cleared at a 25 percent discount, the brand loses over ₹15 lakh in margin. Contribution margin compresses. Cash remains locked for four months. Marketing becomes discount-driven.
What Happens When Inventory Turns Are Lower in This Case
At 3 turns:
- Cash cycle extends beyond 120 days
- Clearance discounts exceed 20 percent
- Dead stock crosses 15 percent
- Credit dependency increases
- ROI on paid ads declines
Now, assume the same brand improves to 6 to 7 inventory turns annually. Inventory rotates every 55 to 60 days. Purchase batches become tighter. Aging inventory drops below 10 percent. Discounting remains controlled under 12 percent of revenue.
What Happens When Inventory Turns Are Higher in This Case
If turnover jumps aggressively to 12 or more turns:
- Bestsellers stock out within 20 to 25 days
- Paid campaigns pause due to stock gaps
- Emergency replenishment increases freight cost
- Marketplace ranking drops temporarily
- Revenue becomes volatile
The ideal inventory turns for D2C brands are balanced. Stable inventory turns D2C improves D2C inventory metrics such as sell-through consistency and reorder accuracy. Extreme highs or lows damage profitability in different ways.
How to Improve Inventory Turns in D2C and Align Them With Growth Stage
 Improving inventory turns D2C is not about pushing more sales. It is about tightening operational control. When buying, forecasting, and replenishment are structured, the ideal inventory turns for D2C brands stabilize naturally.
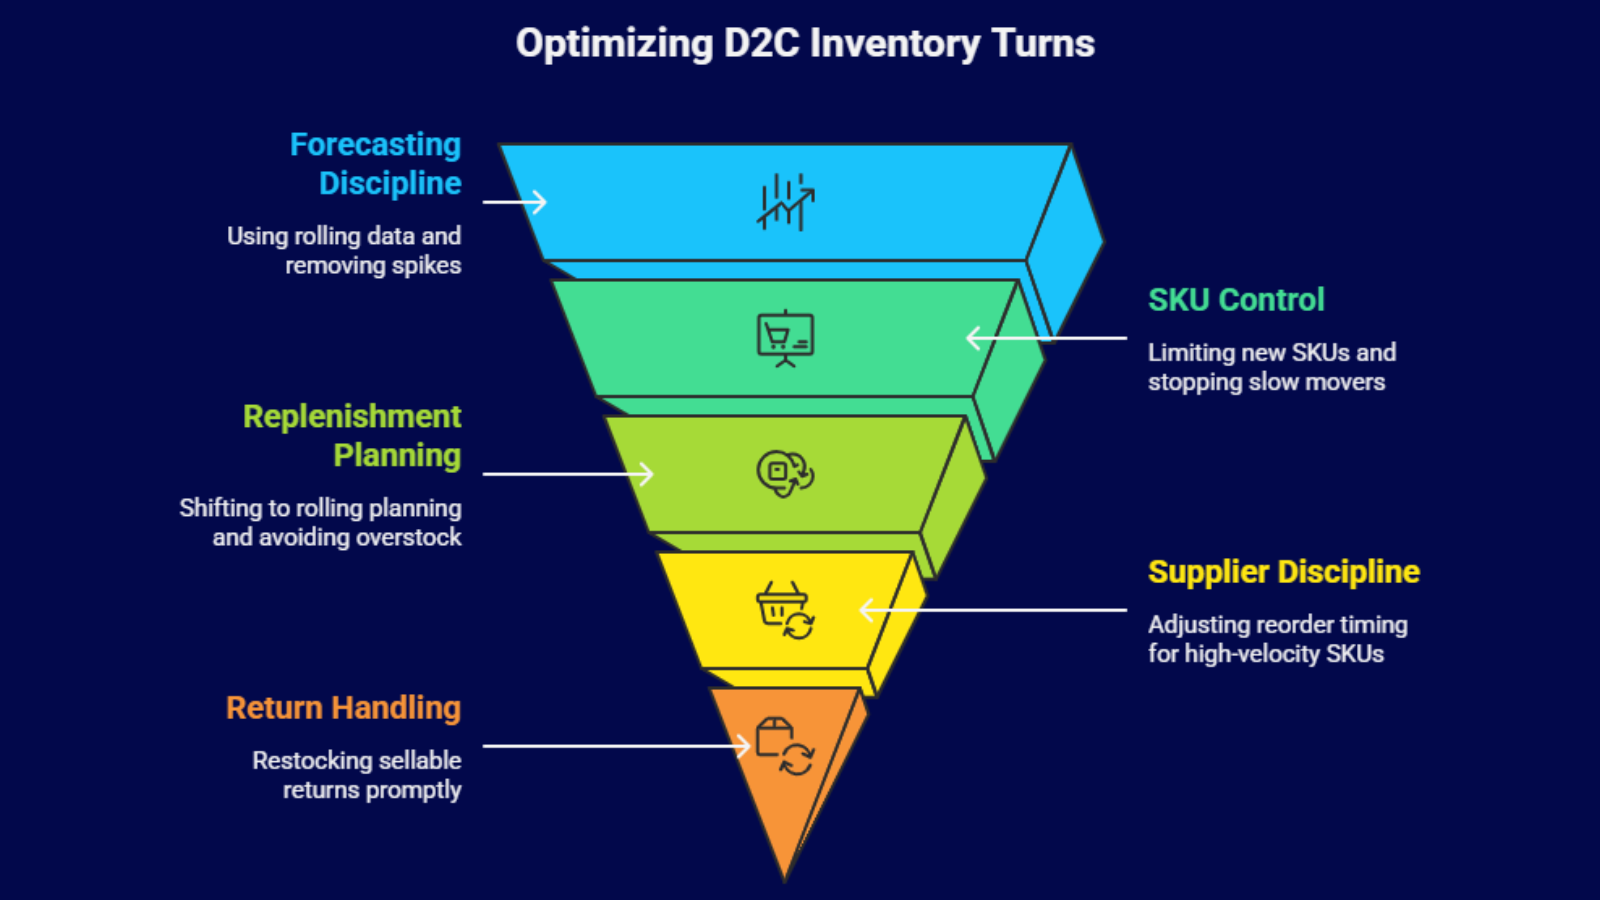
Start with forecasting discipline. Use rolling 90-day sales data instead of annual projections. Remove festive spikes and one-time bulk orders before calculating reorder quantities. Cap fresh procurement at 1.3 times projected 45-day demand. This prevents overbuying and keeps stock aligned with real velocity, directly strengthening D2C inventory metrics.
Next, control SKU expansion. Catalog bloat slows movement and weakens inventory turns D2C. Limit new SKU launches to 10 to 15 percent of your total catalog per quarter. Stop replenishing SKUs that sell less than 1 unit per day after their first 60 days. Capital should stay focused on top revenue-driving SKUs, not underperforming variants.
Replenishment must shift from bulk buying to rolling planning. Set reorder triggers at 25 to 30 days of stock coverage. Avoid holding more than 60 days of inventory unless the supplier lead time genuinely exceeds 40 days. This keeps working capital flexible without increasing stockout risk.
Supplier discipline is equally critical. If vendors consistently exceed promised lead times by more than 15 percent, adjust reorder timing only for high-velocity SKUs instead of increasing blanket safety stock.
Return handling also impacts turnover. Restock sellable returns within 24 to 48 hours. Delayed restocking creates artificial shortages and distorts inventory turns D2C.
Finally, align targets with the growth stage. Early-stage brands should aim for 4 to 6 turns while learning demand patterns. Growth-stage brands should stabilize between 6 and 8 turns. Mature brands with predictable demand can operate between 7 and 10 turns with tighter buffer control. Regular review of D2C inventory metrics ensures inventory remains disciplined and growth stays sustainable.
Common Mistakes D2C Brands Make
Even experienced founders struggle to maintain the ideal inventory turns for D2C brands because small operational gaps compound quickly.
- Ordering based on supplier MOQ pressure instead of real sales velocity, leading to 90 to 120 days of excess stock.
- Ignoring slow SKUs that contribute less than 5 percent revenue but hold more than 15 percent inventory value.
- Scaling paid ads without checking stock coverage causes sudden stockouts or overbuying.
- Using heavy 25 to 40 percent discounts to clear aging inventory instead of correcting forecasting errors.
- Not tracking inventory turns D2C weekly, which delays corrective action.
- Failing to monitor aging buckets, allowing 90+ day stock to cross safe limits.
- Treating D2C inventory metrics as quarterly review data instead of monthly control indicators.
When D2C inventory metrics are not reviewed consistently, cash gets locked silently, margins shrink, and growth becomes unstable.
Why Base.com Becomes the Control Center for Growing D2C Brands
As your brand scales, operations stop being simple. Orders flow from your website, marketplaces, and other channels at the same time. Inventory numbers start mismatching. Bestsellers suddenly go out of stock. Slow-moving SKUs quietly lock up capital. This is exactly where Base.com becomes critical.
Base.com acts as a central operating layer that connects all your sales channels, warehouses, and inventory data into one unified dashboard. Instead of switching between Amazon, Flipkart, Shopify, and spreadsheets, everything becomes visible in real time in one place. Every order automatically updates stock across all channels, reducing overselling and cancellations.
What makes Base.com powerful is not just order syncing. It gives brands clarity over inventory movement and margin performance.
You can track SKU-wise sell-through, identify ageing inventory, monitor channel-wise profitability, and set intelligent reorder alerts based on actual velocity instead of guesswork. This protects cash flow and improves inventory turns without aggressive discounting.
The analytics layer inside Base.com helps founders see which SKUs drive profit, which channels leak margin, and where capital is getting stuck. Instead of reacting to problems at the end of the month, you act early and make informed decisions.
If predictable growth, healthy inventory turns, and controlled expansion matter to your brand, Base.com becomes less of a tool and more of an operational backbone.
Final Thoughts
The ideal inventory turns for D2C brands are not just accounting numbers. They define how fast your business moves. They determine how efficiently your capital works. And they protect your margins from unnecessary discounting.
When inventory turns D2C are balanced between 5 and 8 annually, most brands experience stable growth. But the number alone is not enough. You must track supporting D2C inventory metrics consistently.
Inventory is not about stock. It is about discipline. And discipline builds profitable brands.
Frequently Asked Questions
1. What is a good inventory turnover ratio for D2C brands?
For most categories, 5 to 8 turns per year is considered healthy. This range supports steady cash flow while minimizing stockouts and excess holding costs. The category and margin structure can slightly change this benchmark.
2. How often should D2C brands review inventory turns?
Inventory turns should be reviewed monthly. Fast-moving categories may require weekly monitoring. Regular tracking ensures that purchase decisions align with demand trends and prevent cash from being locked in slow stock.
3. Can high inventory turnover hurt a D2C brand?
Yes. Extremely high turnover can indicate under-stocking. This leads to frequent stockouts, lost sales, and unstable marketing campaigns. Balanced and predictable turnover is more important than aggressive turnover.
4. How do inventory turns affect cash flow?
Higher but controlled inventory turns free up working capital faster. Lower turnover locks money in stock, increases storage costs, and forces discounting. Healthy turnover improves liquidity and financial stability.
5. What tools help improve D2C inventory metrics?
Inventory management systems and OMS platforms help track stock levels, reorder triggers, and SKU performance. Tools like Base.com provide centralized visibility across channels, improving planning and reducing manual errors.