base.blogBase AnalyticsBase Analytics and the AI agent that supports it.

Base Analytics and the AI agent that supports it.

Matt Weiser
Marketing leader with a decade of experience in the e-commerce and marketplace space, building go-to-market strategy, messaging frameworks, and the cross-functional processes that drive real execution. Known for translating complex platforms into clear, compelling narratives that resonate with the right audiences.
B


Base Analytics

Detailed analytics across every channel, and an AI agent to support you.

Base Analytics turns every sales channel into one clear view of your business, and a built-in AI agent turns that view into answers in seconds. No exports, no waiting on ops, no spreadsheets to stitch together.

Base Team· 7 min read · Analytics & AI


A quick look at the Analytics AI agent building a dashboard from a plain-language prompt.

Most ecommerce teams have a data problem, just not the one people expect. The hard part isn’t making the decision. It’s centralizing everything first: pulling orders, costs, fees, inventory, and returns out of every marketplace, storefront, and spreadsheet, then reconciling it all into numbers you can actually trust. That work is so slow and manual that decisions end up made on gut feel, or made too late.

Base Analytics takes that work off your plate. It centralizes all of your channel and store data into one dashboard, with one definition of gross sales and one definition of margin applied everywhere, so the heavy lifting is done for you and making a data-backed decision becomes the easy part again. No extra systems to run, no data team required.

Below, a tour of what it measures, the dashboards you’ll actually use, and the AI agent that answers the follow-up questions for you.

One source of truth

Every channel, measured the same way

You can only improve what you can measure. The KPI dashboard is the top-level read on the business: gross sales, the value lost to cancels and returns, net sales, costs, and the margin you actually kept. Each carries its change against the previous period, so a number never sits without context.

Key metrics · last 90 days
48 states · 6,842 orders
Gross sales (GMV)
$486,204

▲ +12.4%

Net sales
$405,190

▲ +11.2%

Sales margin
$115,340

▲ +14.6%

Cancels & returns
$21,340

▼ −4.1%

Orders
6,842

▲ +8.3%

Cost of goods sold
$214,880

+10.1%

Reporting that goes deep

True profit, month over month

Revenue flatters; margin tells the truth. Base Analytics calculates a real-time profit and loss with COGS, marketplace commissions, and shipping already factored in, so you see what you actually kept, not just what you sold. Every line rolls up from the same source data as the KPIs above, which means the P&L and the dashboard never disagree.

Profit & loss · Q2 2026
Metric Apr May Jun
Gross sales (GMV) $148,920 $171,540 $165,744
Cancels & returns −6,110 −7,420 −7,810
Net sales $130,880 $150,440 $145,424
Cost of goods sold −68,940 −78,110 −76,220
Marketplace commission −13,120 −14,880 −14,340
Shipping cost −10,350 −11,230 −11,300
Sales margin $38,470 $46,220 $43,564
Payment processing fees −4,180 −4,690 −4,510
Promotions & discounts −5,240 −6,010 −5,880
Net margin $29,050 $35,520 $33,174
Net margin % 22.2% 23.6% 22.8%

Where you ship

Watch your performance, region by region

For US sellers, where an order goes matters as much as how many you sell. Shipping zones, delivery times, and regional demand all move your real margin. Base Analytics maps every order to the state it shipped to, so you can see which regions drive volume, spot where growth is slowing, and plan inventory and carriers around the places that matter most.
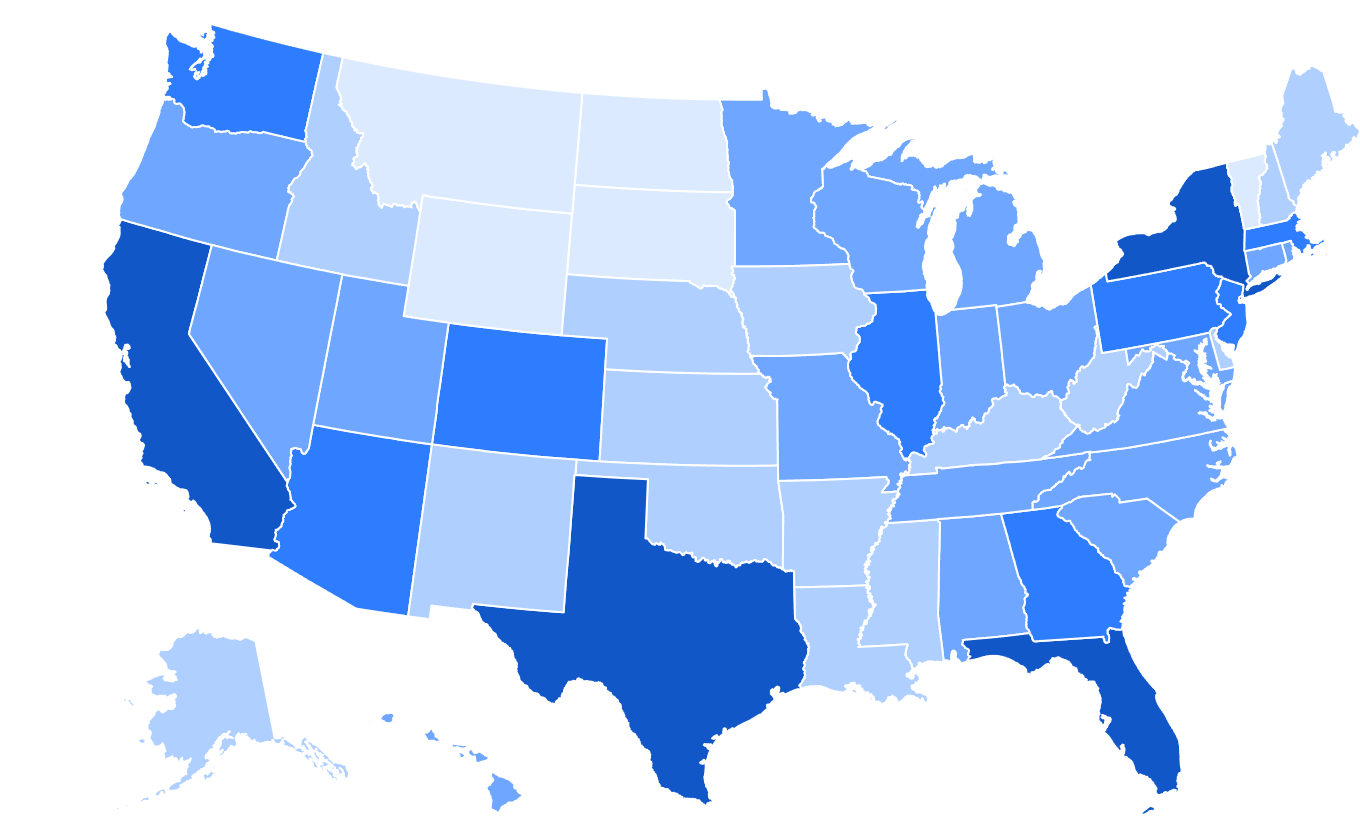
States shipped to · last 90 days
48 states · 6,842 orders
US map of states shipped to, shaded by order volume
Fewer orders

More orders

The AI agent

Ask a question. Get a decision.

Dashboards answer the questions you already know to ask. The follow-ups, like why did margin dip in May, and which products drove it, are where teams lose hours. The Analytics AI agent closes that gap. Ask in plain language, and it builds the dashboard, reads the results, and explains what happened.

01
You ask
One prompt, in plain English. No query language, no filters to configure.
02
It builds & explains
A full dashboard appears in seconds, with tables, charts, and a written read-out of what it means.
03
You share
Send it straight to the team, or save the conversation to revisit later.

Base Analytics AI

Base Analytics AI
Your intelligent analyst
Break down Q2 sales by product
Q2 sales breakdown by product

Total: $288,540 across 48 products · excluding canceled and returned orders

Product Net sales Orders % of total
Foundation Plate $84,120 1,104 29%
Folding Water Bottle $41,660 612 14%
Ballpoint Pen Set $38,940 648 14%
Insulated Tumbler $34,210 590 12%
Crew Neck T-Shirt, Black $30,880 496 11%
Ceramic Mug, 12oz $22,540 508 8%
Key takeaways
The Foundation Plate alone is ~29% of Q2 net sales.
The top six products drive 87% of revenue, worth prioritizing for stock and ad spend.
The Ballpoint Pen Set and Ceramic Mug sell in high volume at a lower price, strong candidates to bundle.

AI-generated alerts, before you go looking

A new top seller, rising returns, or a sudden drop in a channel: the AI watches for the moments that matter and tells you directly, in-app and by email. Each alert explains what happened and why it matters, and suggests the action worth considering next. It’s the difference between finding a problem on Monday’s report and hearing about it the moment it starts.

No separate BI tool
All of this is included with Base, nothing to wire up.

Because Analytics reads the same orders, costs, and inventory that Base already runs your operation on, there’s no data pipeline to build and no BI vendor to add to the stack. The reporting of a data team, and the analytical depth of a dedicated tool, without hiring or buying either.

See Base Analytics on your own numbers

Start free in minutes, or have us walk you through it on a live demo.

Need more information first? A demo is the fastest way to see it against your channels.
About author
Matt Weiser
Matt Weiser is Senior Marketing Manager at Base.com, where he leads go-to-market strategy and content for the U.S. market. He brings a decade of experience across ecommerce operations, marketplace strategy, and product marketing, spanning enterprise-level marketplace management, self-service product launches, and the messaging frameworks that help complex platforms go to market clearly. Before moving into marketing, Matt ran high-volume ecommerce operations firsthand, giving him a ground-level understanding of the operational challenges multichannel sellers face every day.

Add comment

Time of publication
Category
Tags