
Reaching ₹10Cr ARR feels like validation. It tells you the product works, customers are buying, and demand exists. But this is also the stage where many Indian D2C brands unknowingly enter risky territory. The numbers look good on the surface, yet cash pressure slowly starts building in the background.
Till this point, growth hides inefficiencies. Discounts feel manageable, ad spends feel justified, and logistics costs do not seem alarming. But once order volumes increase, the same decisions start showing cracks. Marketing bills rise faster than revenue, returns pile up, and margins quietly shrink. This is exactly when D2C unit economics stop being optional and start becoming essential.
At ₹10Cr ARR, revenue alone no longer tells the full story. What actually matters is how much money stays with the business after every real cost is paid. That includes ads, shipping, returns, payment fees, and packaging. If each order does not leave enough behind, growth only increases losses. This is why brands that successfully scale to ₹50Cr and ₹100Cr ARR obsess over D2C unit economics, not just topline numbers.
Another big shift at this stage is how founders look at margins. Early on, gross margin feels sufficient. But at scale, it hides too much. You need to understand contribution margin in D2C, because it shows what each order truly contributes toward running the business and funding future growth. Without this clarity, decisions around discounts, channels, and expansion become guesswork.
This is also where early metrics start failing. ROAS looks healthy, but profits do not improve. AOV grows, yet cash feels tight. These are signals that unit economics needs attention. In the sections ahead, we break down which unit economics actually matter after ₹10Cr ARR, why Indian D2C sellers struggle at this stage, and how to think about contribution margin D2C in a simple, practical way that supports sustainable growth.
Why Unit Economics Change After ₹10Cr ARR and Where Brands Go Wrong
Crossing ₹10Cr ARR feels like a breakthrough moment. Orders are consistent, paid ads appear predictable, and the growth engine seems proven. But this is precisely where unit economics begins to change in ways that are easy to underestimate. What worked at ₹3Cr or ₹5Cr often becomes fragile at ₹10Cr and beyond.
In the early phase, growth is prioritized over efficiency. A CAC of ₹300 to ₹400 feels manageable because revenue is accelerating. Discounts are frequent, margins are thinner, and the assumption is that scale will eventually improve profitability. At ₹10Cr ARR, however, competition intensifies. Meta CPMs rise, Google Search CPC increases year after year, and creative fatigue sets in faster. CAC that once sat at ₹350 can move to ₹700 or even higher in competitive categories like fashion or beauty. That single shift dramatically alters contribution margins.
At the same time, operating costs grow with volume. Shipping, reverse logistics, warehousing, packaging, and support teams expand. In India, shipping and RTO alone can consume 10 to 15 percent of revenue if not tightly controlled. Consider a fashion brand with a ₹1,500 AOV and 28 percent return rate. Add ₹120 forward shipping, ₹90 reverse logistics, COD handling charges, and payment gateway fees. What looked like a healthy 60 percent gross margin quickly compresses at the contribution level. Yet many brands continue scaling these SKUs because topline revenue looks strong.
 Cash flow adds another layer of pressure. Inventory and ad spend are paid upfront. Marketplace settlements and payment gateway collections arrive 30 to 45 days later. A brand doing ₹1Cr per month might have ₹1.5Cr tied up in receivables and another ₹2–3Cr locked in inventory. On paper, the business is profitable. In reality, liquidity becomes tight, forcing founders to delay vendor payments or rely on short-term credit. Growth becomes stressful rather than empowering.
After ₹10Cr ARR, the fundamental question changes. It is no longer about whether customers will buy. It is about whether each order leaves enough money behind to fund future growth.
Several predictable mistakes emerge at this stage:
- Ignoring contribution margin during sale periods. Brands chase revenue targets during Diwali or End of Season Sales without recalculating CM2 after discounts, ads, logistics, and commissions. Order volume rises, but actual earnings shrink.
- Scaling ads without CAC control. When ROAS dips from 4:1 to 3:1, budgets are increased to maintain volume. Payback windows quietly stretch from 60 days to 120 days, increasing cash risk.
- Treating logistics as fixed. RTO rates climb in certain pincodes, but no structured tracking exists by courier, SKU, or payment mode. Losses compound silently.
- Over-discounting to protect growth. Customers become conditioned to wait for 25 to 30 percent offers. Full-price demand weakens, and margins compress permanently.
At ₹10Cr ARR and beyond, gross margin and revenue are insufficient health indicators. Brands must track contribution margin by SKU and channel, CAC payback periods, inventory turns, and cash conversion cycles with discipline. Those who evolve their financial rigor here build sustainable scale. Those who do not end up expanding fragile economics that eventually slow them down.
The Unit Economics That Actually Decide Scale After ₹10Cr ARR
Crossing ₹10Cr ARR is a major milestone for any Indian D2C brand. It signals product-market fit, demand consistency, and early operational maturity. But this is also the stage where many brands unknowingly step into dangerous territory.
Growth continues, revenue charts look healthy, yet cash pressure increases, and profitability stays out of reach. This is not a demand problem. It is a unit economics problem.
After ₹10Cr ARR, the business changes in nature. Decisions that earlier had limited impact now compound quickly. Marketing spends rise faster than revenue, logistics costs stop being negligible, and cash flow timing begins to hurt daily operations. At this stage, founders who understand and control D2C unit economics build durable brands. Those who do not often stall between ₹20Cr and ₹50Cr ARR.
This section explains, in detail, which unit economics matter after ₹10Cr ARR, how to calculate them properly, and how real Indian D2C brands across categories have used them to scale sustainably.
1. Why Gross Margin Stops Telling the Full Story
 Most founders start by tracking gross margin because it is simple and intuitive.
Gross Margin (%) = (Selling Price − Cost of Goods Sold) ÷ Selling Price × 100
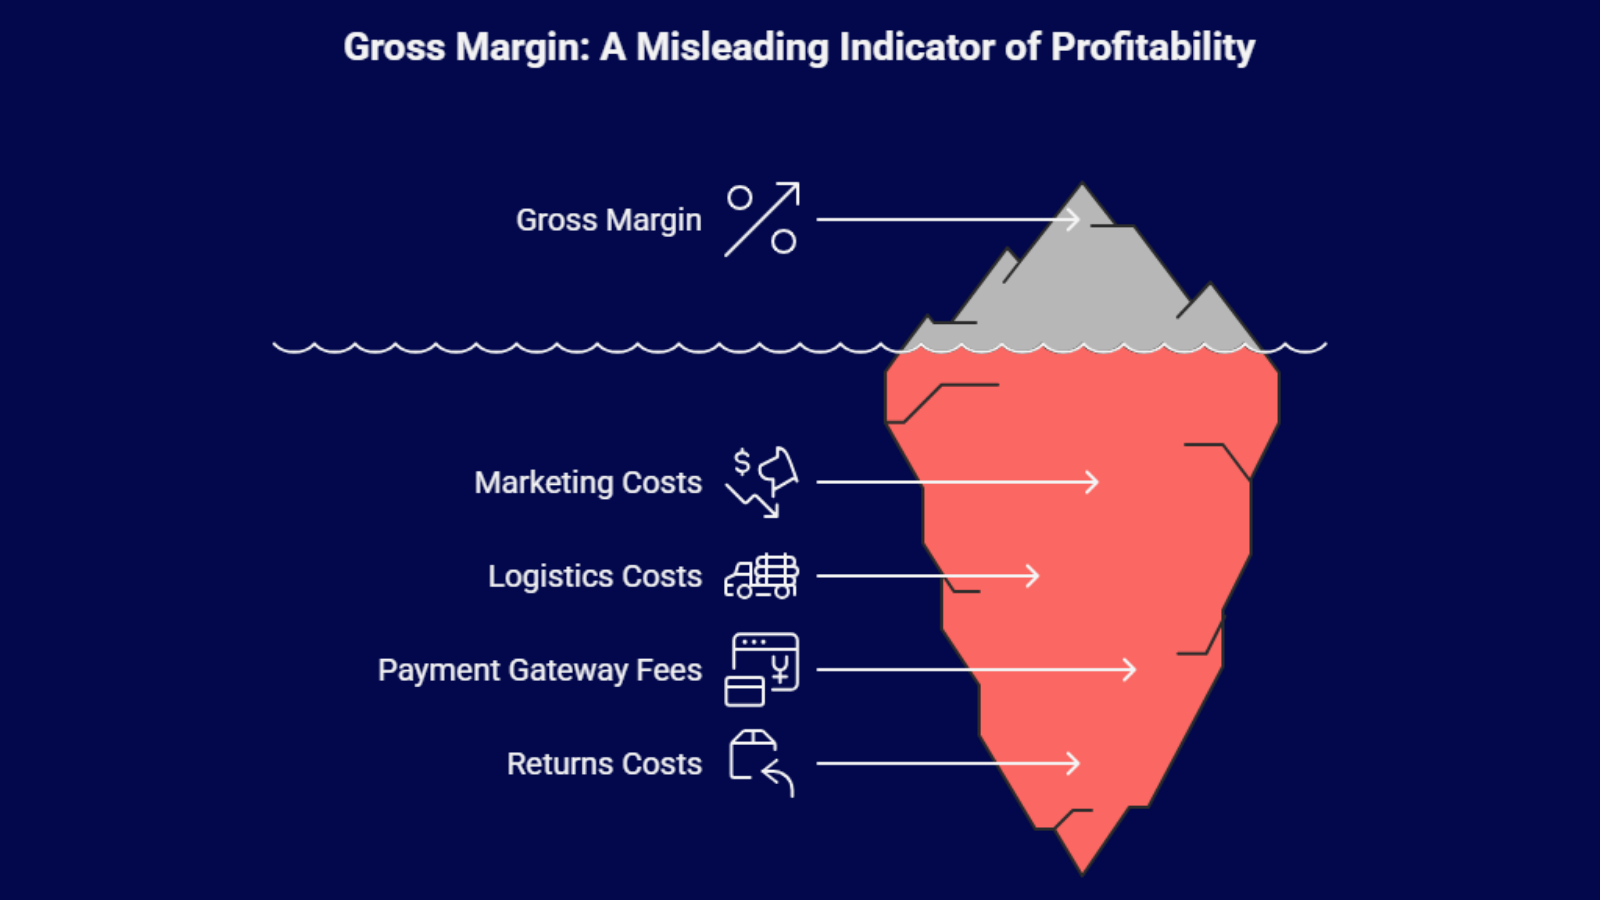
Gross margin helps validate pricing and sourcing in the early days. If this number is weak, the business is fundamentally broken. But once a brand crosses ₹10Cr ARR, gross margin alone becomes misleading. It does not account for marketing costs, logistics, payment gateway fees, or returns. These costs scale with volume and quietly eat into profits.
Many Indian D2C brands report gross margins of 60% or more and still struggle to make money. The reason is simple. Gross margin ignores the costs that matter most at scale. This is why mature founders shift their focus to contribution margin.
Contribution Margin Is the Real Measure of Sustainability
Contribution margin shows what actually remains from each order after all variable costs are paid. This is the most important metric in D2C unit economics after ₹10Cr ARR.
Contribution Margin per Order = Revenue per Order − COGS − Marketing Cost per Order − Shipping & Packaging Cost − Payment Gateway & Platform Fees − Returns & RTO Cost
What remains is the contribution margin D2C. This is the money that funds salaries, tools, rent, technology, and eventually profit. If the contribution margin is weak, growth only increases losses.
Case Study:
A strong example from the Indian personal care category is Mamaearth, which scaled by focusing not just on revenue growth but on contribution margin discipline.
In personal care, gross margins can range between 60 to 70 percent. But gross margin is not the real story. Contribution margin shows what remains after variable costs like ad spend, shipping, returns, payment gateway fees, and platform commissions.
The basic formula is:
Contribution Margin (CM1) = Revenue – Cost of Goods Sold – Marketing Spend
CM2 = CM1 – Logistics – Payment Fees – Returns – Marketplace Commissions
For example, assume:
- AOV = ₹800
- COGS (35%) = ₹280
- Marketing (CAC per order) = ₹300
- Shipping + RTO blended = ₹100
- Payment + misc fees = ₹40
CM1 = 800 – 280 – 300 = ₹220
CM2 = 220 – 100 – 40 = ₹80
That leaves ₹80 per order before fixed costs.
If repeat purchase increases from one to three orders per customer, the effective CAC per order drops sharply. Instead of ₹300 per order, a ₹300 CAC spread across three purchases becomes ₹100 blended CAC.
Revised CM1 = 800 – 280 – 100 = ₹420
Revised CM2 = 420 – 100 – 40 = ₹280
That is a 3.5x improvement in contribution margin purely from retention.
This is where Mamaearth’s strategy mattered. By pushing bundles, routines, and category cross-sell, they improved repeat purchase behavior. Higher lifetime value meant blended CAC reduced over time. That protected contribution margin even as acquisition costs across Meta and Google rose.
Strong contribution margin allowed reinvestment into new categories without aggressive discounting or excessive cash burn. The lesson is clear: at scale, retention is not just a marketing tactic. It is a margin multiplier.
2. Marketing Efficiency Becomes a Unit Economics Decision
 Before ₹10Cr ARR, marketing was largely experimental. Founders test channels, creatives, influencers, and offers. After ₹10Cr ARR, marketing becomes the highest variable cost in the business. Even a small inefficiency can wipe out margins.
At this stage, brands stop looking at ROAS in isolation and start connecting marketing spend directly to contribution margin.
Two formulas become critical.
Blended CAC = Total marketing spend ÷ Total number of orders
CAC Payback Period = Customer Acquisition Cost ÷ Contribution margin per order
If CAC payback stretches beyond 60 to 90 days, growth becomes risky. Cash gets locked before returns are realized.
3. Logistics, RTO, and Returns Can Quietly Destroy Margins
Logistics is one of the most underestimated costs in Indian D2C. At lower volumes, inefficiencies are easy to absorb. At scale, even a 1% to 2% increase in RTO can significantly reduce profitability.
Total logistics cost includes more than just forward shipping.
Total Logistics Cost = Forward Shipping Cost + Reverse Logistics Cost + Packaging Cost + Damaged or Unsellable Inventory Write-offs
All of this directly reduces contribution margin D2C.
Case Study:
A clear example from apparel is Bewakoof, which operates in one of the highest return-rate categories in Indian D2C. In fashion, return and RTO rates can easily cross 20 to 30 percent if unmanaged. Instead of treating this as a fixed cost of doing business, the brand approached RTO as a controllable variable inside unit economics.
To understand the impact, consider a ₹1,200 AOV order:
- Forward shipping: ₹120i
- Reverse logistics (if RTO): ₹100
- Packaging and handling: ₹40
- COD charges: ₹30
If RTO sits at 18 percent, the blended logistics cost per shipped order rises sharply. For every 100 orders, 18 come back, meaning you incur both forward and reverse costs without revenue realization.
Blended RTO cost formula:
Blended RTO Impact = (RTO % × (Forward + Reverse + COD))
At 18 percent RTO:
0.18 × (120 + 100 + 30) = ₹45 per order extra leakage
If RTO is reduced to 8 percent:
0.08 × 250 = ₹20 per order
That ₹25 difference per order, at 10,000 monthly shipments, equals ₹25 lakhs saved annually.
Bewakoof focused on:
- Improving size charts and product descriptions to reduce fit-related returns
- Reducing COD dependency in high-risk pincodes
- Tracking courier-wise RTO performance and reallocating lanes
- Strengthening NDR (non-delivery report) follow-ups
Brands that consistently keep RTO below 8 percent outperform peers not just on margin but on cash flow. Lower reverse logistics means faster inventory turns, reduced working capital blockage, and healthier contribution margin. In return-heavy categories, RTO discipline is not an operations metric. It is a unit economics lever.
4. Average Order Value Is a Margin Lever, Not Just a Growth Metric
 Many founders chase AOV to grow revenue. After ₹10Cr ARR, AOV directly impacts profitability.
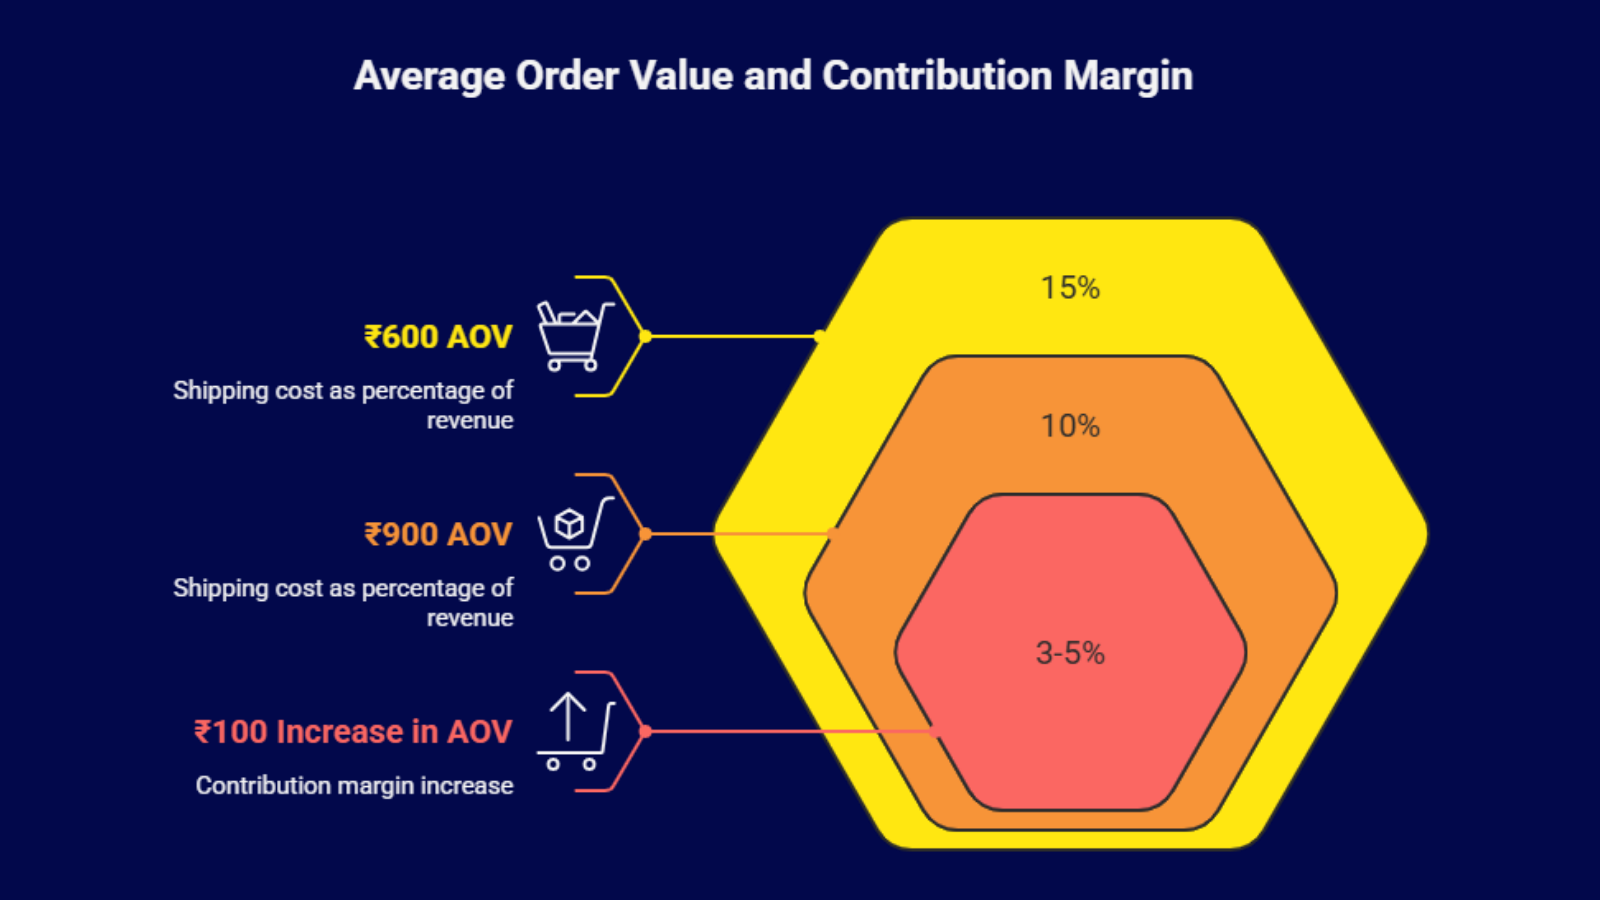
Higher AOV spreads fixed costs like shipping and marketing over more revenue. This improves D2C unit economics without increasing ad spend.
For example, if shipping costs ₹90 per order, a ₹600 AOV means shipping consumes 15% of revenue. At ₹900 AOV, the same shipping cost drops to 10%.
Minimalist, a skincare brand, used this insight effectively. Instead of deep discounts, the brand focused on routine-based bundles. AOV increased while CAC remained stable, leading to a meaningful improvement in contribution margin D2C without harming brand perception.
In most categories, every ₹100 increase in AOV can add 3 to 5 percentage points to contribution margin.
5. Repeat Customers Multiply Margins
Retention is not a branding initiative. It is a unit economics strategy.
Repeat customers reduce acquisition costs, increase lifetime value, and stabilize cash flows. Since repeat orders often require little to no marketing spend, their contribution margins are significantly higher.
Repeat Order Contribution = Revenue from Repeat Orders − Variable Costs of Repeat Orders
Brands with repeat rates above 35% usually handle pricing pressure and competition far better than acquisition-heavy brands.
The Unit Economics Dashboard Founders Cannot Ignore
 After ₹10Cr ARR, intuition becomes dangerous. Founders need real-time visibility into how the business is actually performing.
A strong dashboard connects revenue, costs, and margins at an order level.
- Order-level contribution margin to understand profitability per order
- Channel-wise CAC to see which channels are truly scalable
- RTO and return rates to measure logistics and revenue leakage
- AOV by customer cohort to track value across customer segments
- Repeat purchase contribution to evaluate long-term customer value
When these metrics are clearly visible, D2C unit economics become actionable rather than theoretical. Growth, operations, and finance teams can align around the same numbers and make faster, better decisions.
How Smart Brands Fix Unit Economics at Scale
Smart brands do not slow down once they hit ₹10Cr ARR. They grow differently. Instead of chasing every order, they focus on improving the quality of growth. The goal shifts from selling more to selling better. This is where disciplined work on D2C unit economics begins to show results.
One of the first changes winning brands make is cutting loss-making SKUs. Not every product deserves to scale. Some SKUs look good on revenue but destroy margins due to high returns, low AOV, or expensive shipping. Removing or reworking these products immediately improves contribution margin D2C without touching top-line growth.
The next lever is logistics optimization. Brands analyze shipping data by zone and courier partner. Orders shipped across long distances or through inefficient routes often cost significantly more. By optimizing shipping zones and renegotiating courier rates, brands reduce per-order logistics cost and strengthen D2C unit economics at scale.
Reducing COD dependency is another powerful fix. High COD orders usually come with higher RTO and delayed cash flows. Smart brands gradually push prepaid orders through better incentives, trust-building communication, and clearer delivery timelines. Lower COD means lower reverse logistics and better contribution margin D2C.
 Packaging efficiency also plays a quiet but important role. Over-packaging increases material cost and volumetric weight. Brands that redesign packaging to be lighter and more compact often see immediate savings across thousands of orders.
Individually, these changes may seem small. Together, they compound quickly. That is how strong D2C unit economics are built, and contribution margin D2C improves quarter after quarter.
Final Thoughts
Crossing ₹10Cr ARR is not the finish line. It is where the real business begins. Growth without control becomes dangerous at this stage. Brands that win long term obsess over D2C unit economics and protect contribution margin D2C like a core asset. When every order makes sense, scale becomes sustainable.
If you are serious about scaling profitably after ₹10Cr ARR, Base helps you track order-level profitability, margins, and cash flow in one place. No spreadsheets. No guesswork. Just clear visibility into what actually drives profit. Visit Base.com and start building stronger D2C unit economics today.
FAQs
1. What changes in unit economics after ₹10Cr ARR for D2C brands?
After ₹10Cr ARR, costs such as marketing, logistics, and returns scale faster than revenue. Brands must move beyond gross margin and focus on contribution margin to ensure each order’s funds grow instead of increasing losses.
2. How do D2C brands calculate contribution margin correctly?
Contribution margin is calculated by subtracting all variable costs from revenue per order. This includes product cost, marketing spend, shipping, payment gateway fees, and returns. It shows the real profitability of each order.
3. What is a good contribution margin for Indian D2C brands?
A healthy contribution margin for Indian D2C brands usually ranges between 20% and 35%. The exact number depends on category, AOV, logistics complexity, and return rates, but margins below 15% are risky at scale.
4. Why do many D2C brands struggle with profitability despite high revenue?
Many brands grow revenue through discounts and high ad spend without controlling unit economics. When CAC, logistics, and returns are ignored, growth increases losses instead of profit, even if topline numbers look strong.
5. How can Indian D2C brands improve unit economics without slowing growth?
Brands improve unit economics by cutting loss-making SKUs, increasing AOV through bundles, reducing RTO and COD dependency, improving repeat purchases, and tracking contribution margin at an order level instead of chasing revenue alone.