India’s e-commerce boom looks spectacular on the surface. With the market racing toward $163 billion by 2026, growth headlines are everywhere. Order volumes are up. GMV charts are green. Dashboards look healthy.
But here’s the uncomfortable truth most sellers discover too late: top-line growth is often a vanity metric.

A brand celebrating a 30% jump in orders may actually be bleeding cash underneath. Why? Because 20% to 30% of gross revenue quietly disappears before it ever reaches the EBITDA line, lost to hidden operational costs most teams never see clearly.
Nowhere is this more brutal than Cash on Delivery (COD).
For Indian sellers, a failed COD order doesn’t just mean “no sale.” It creates a triple-loss:
- You pay forward shipping to deliver the order
- You absorb reverse logistics when it’s rejected
- Your inventory capital stays blocked, unable to generate returns elsewhere
Multiply this across thousands of orders, and profitability erodes fast.
This is where many brands go wrong. They look for answers in manufacturing costs, ad spends, or platform commissions, while the real damage is happening quietly between “Order Placed” and “Settlement Received.”
Missed confirmations. Delayed dispatches. RTO spikes. Aging inventory. Settlement mismatches.
These aren’t operational “edge cases.” They’re profit leakages hiding in plain sight.
In today’s Indian e-commerce ecosystem, understanding these blind spots isn’t optional, it’s the difference between scaling revenue and scaling losses. The brands that win aren’t just growing faster.
They’re plugging the leaks before growth exposes them.
The Hidden Architecture of Margin Erosion in India
The Indian market presents a unique set of challenges, from the high prevalence of COD to the geographical complexities of Tier 3 and Tier 4 logistics. When these factors are not meticulously tracked, they lead to significant margin erosion. Sellers often operate on “gut feel” rather than granular data, failing to realize that their most popular products might actually be their least profitable after accounting for all variables.
The following analysis breaks down the ten most critical areas where cost leakage occurs and how they impact the overall ecommerce profitability of Indian businesses.
1. The RTO (Return to Origin) Death Spiral
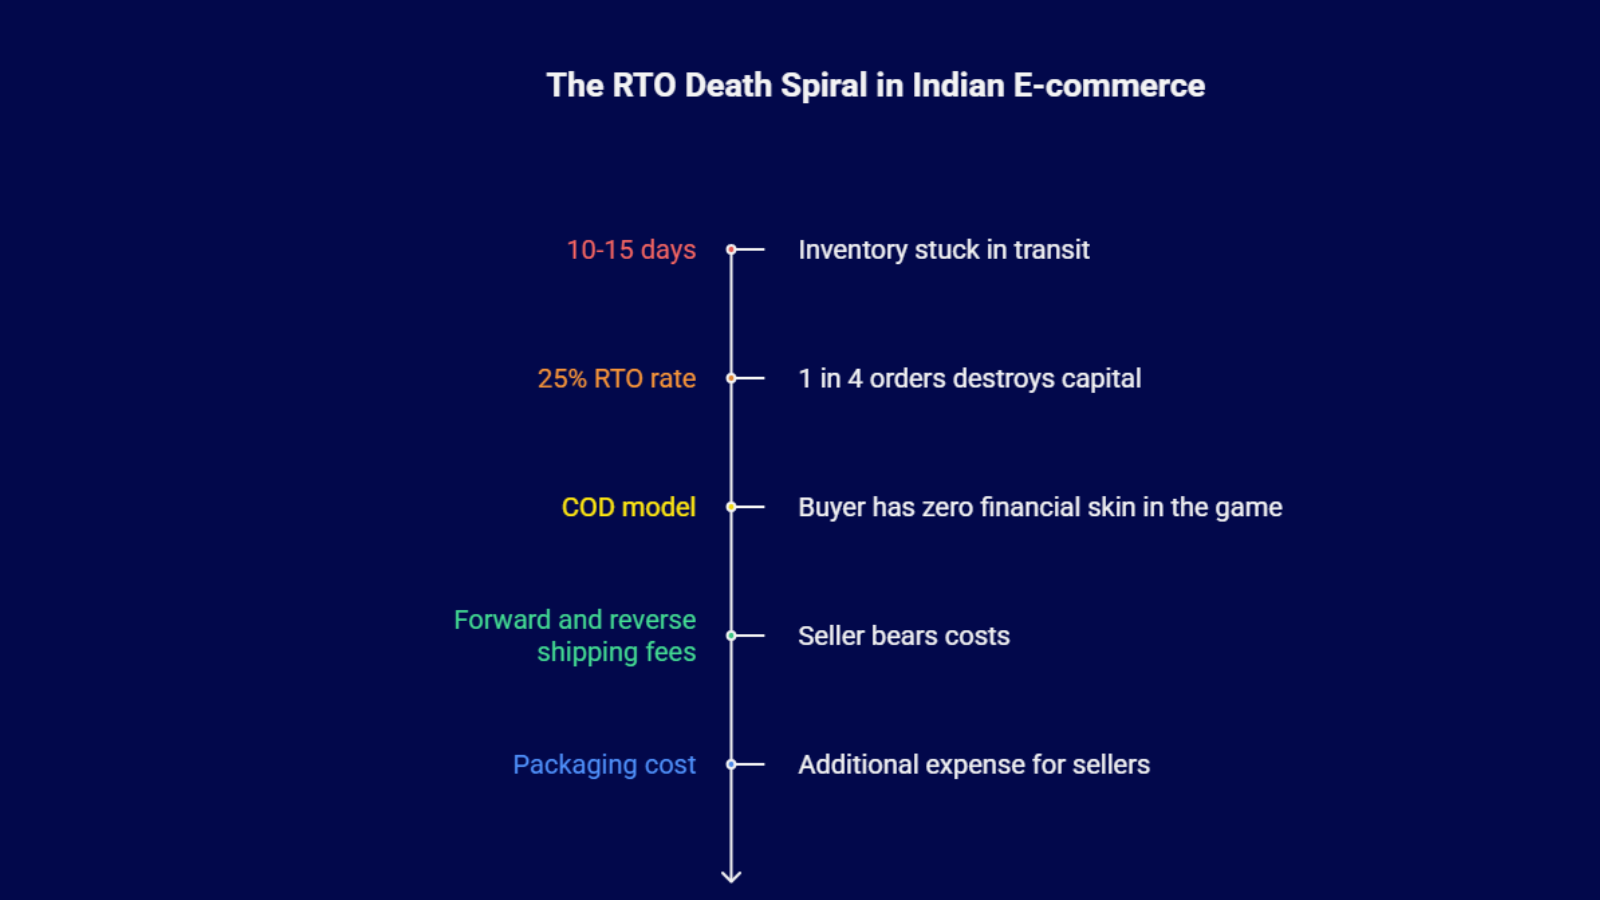
In India, Return to Origin (RTO) is the silent killer of D2C dreams. Unlike a standard return where a customer receives the product and sends it back, an RTO occurs when the delivery is never completed. This is predominantly driven by the COD model, where the buyer has zero financial “skin in the game.”
When an order results in an RTO, the seller bears the forward shipping fee, the reverse shipping fee (often 1.2x to 1.5x the forward cost), and the packaging cost. Furthermore, the inventory is stuck in transit for 10-15 days, missing other potential sale opportunities.
- Financial Impact: For a brand with a 25% RTO rate, nearly 1 in 4 orders actively destroys capital rather than creating it.
- Operational Blind Spot: Most sellers only track “Return %” on their dashboards, failing to separate RTO from customer-initiated returns, which requires a completely different mitigation strategy.
2. Marketplace “Fine Print” and Fee Creep
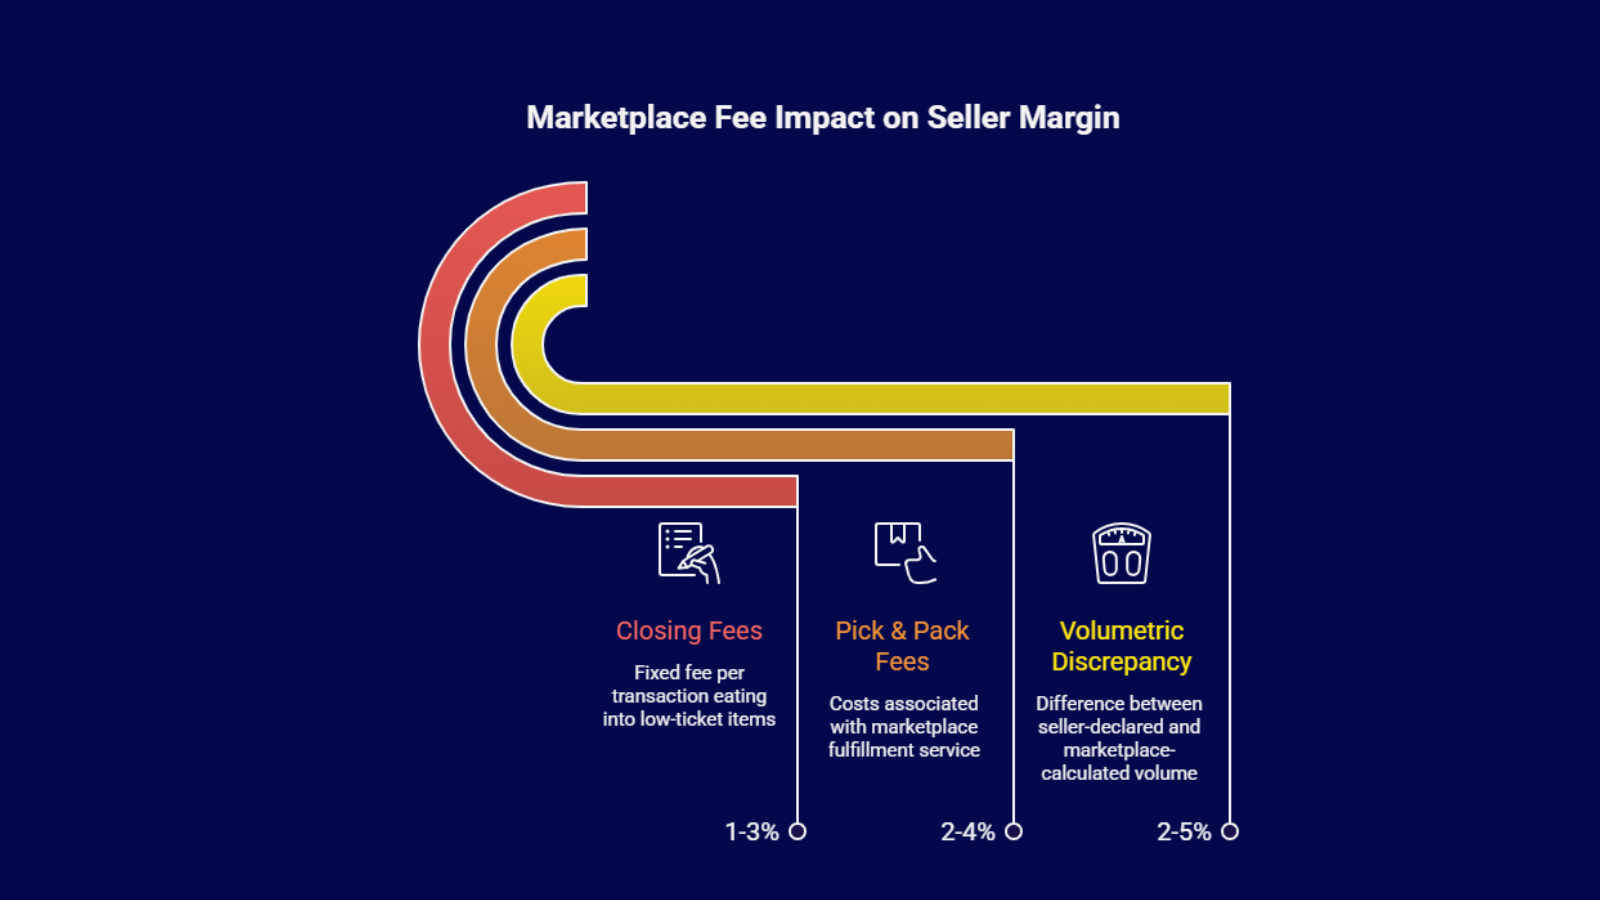
Selling on major marketplaces provides massive reach, but it comes at a price that goes far beyond simple commission. Hidden within the settlement reports are various deductions: closing fees, weight handling fees based on “volumetric weight” (which is often higher than actual weight), and referral fee updates that change without much fanfare.
| Cost Component | Typical Impact on Margin | Description |
|---|---|---|
| Volumetric Discrepancy | 2-5% | Difference between seller-declared weight and marketplace-calculated volume. |
| Closing Fees | 1-3% | A fixed fee per transaction that eats into low-ticket items disproportionately. |
| Pick & Pack Fees | 2-4% | Costs associated with the marketplace’s fulfillment service (FBA/Flipkart Advantage). |
3. Payment Gateway and COD Collection Charges
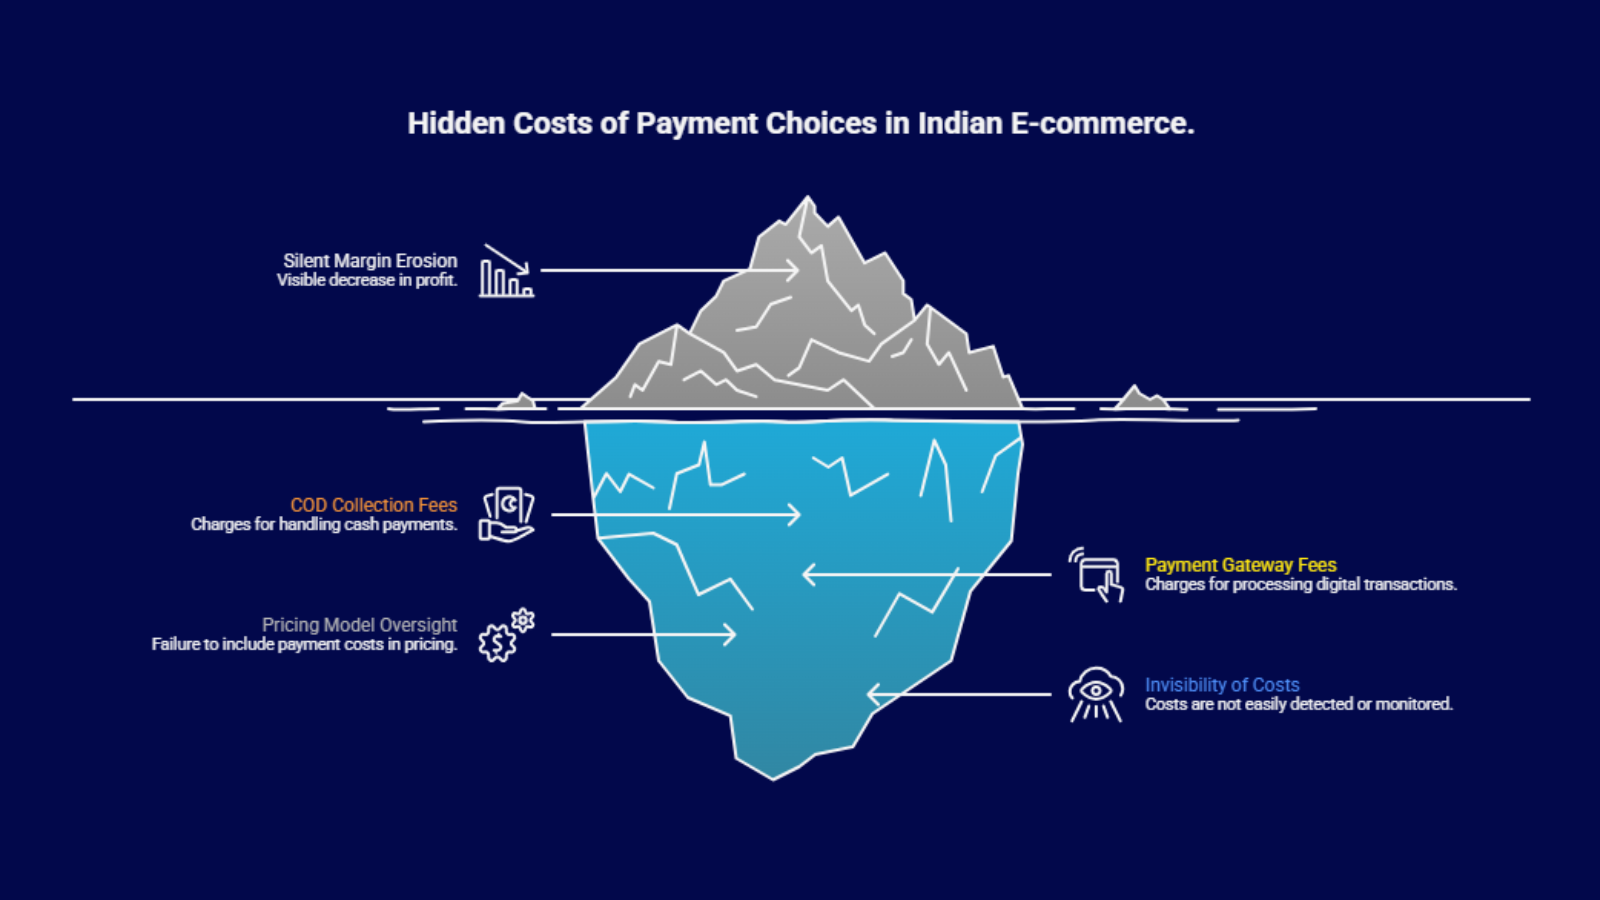
While digital payments are steadily gaining ground, Cash on Delivery (COD) still dominates non-metro India, accounting for over 60% of all e-commerce transactions. For brands expanding beyond metro cities, COD isn’t a choice, it’s a necessity. But it comes at a hidden cost many sellers underestimate.
Every COD order carries a COD Collection Fee, charged by logistics partners. This is typically structured as either a percentage of the order value or a flat fee, whichever is higher. On low-AOV orders, this flat fee quietly eats into margins. On high-AOV orders, the percentage-based fee compounds losses at scale.
Prepaid orders, often assumed to be “cleaner” and cheaper, aren’t cost-free either. Payment gateways charge 2% to 3% plus GST on every successful transaction. While this fee seems small in isolation, it becomes a persistent revenue drain when applied across thousands of orders each month.
The real issue isn’t the existence of these charges, it’s that many sellers don’t factor them into pricing models at all.
Instead, pricing decisions are made around manufacturing cost, platform commission, and ad spend. Payment and collection fees are treated as operational noise. Over a fiscal year, this “noise” turns into lakhs of rupees in silent margin erosion.
What makes this especially dangerous is invisibility. These costs don’t trigger alerts. They don’t spike suddenly. They just show up as slightly lower contribution margins month after month, until profitability feels permanently out of reach.
Winning brands don’t debate COD versus prepaid in absolutes. They price for reality, not assumptions. They model payment costs at the SKU level, push prepaid where unit economics allow, and actively monitor how transaction mix impacts margins.
In Indian e-commerce, payment choice isn’t just a checkout preference, it’s a pricing decision with long-term profit consequences.
COD vs Prepaid: Hidden Cost Breakdown
| Cost Component | COD Orders | Prepaid Orders |
|---|---|---|
| Customer Payment Method | Cash at delivery | UPI / Cards / Wallets |
| Key Fee Charged | COD Collection Fee | Payment Gateway Fee |
| Typical Charge | % of order value or flat fee (higher applies) | 2%–3% + GST |
| Visibility in Dashboards | Low | Low |
| Impact on Margins | High on low-AOV & RTO-prone orders | High at scale |
| Common Seller Mistake | Ignoring flat fee impact | Not pricing in gateway costs |
| Annual Impact | Margin erosion + logistics risk | Silent revenue leakage |
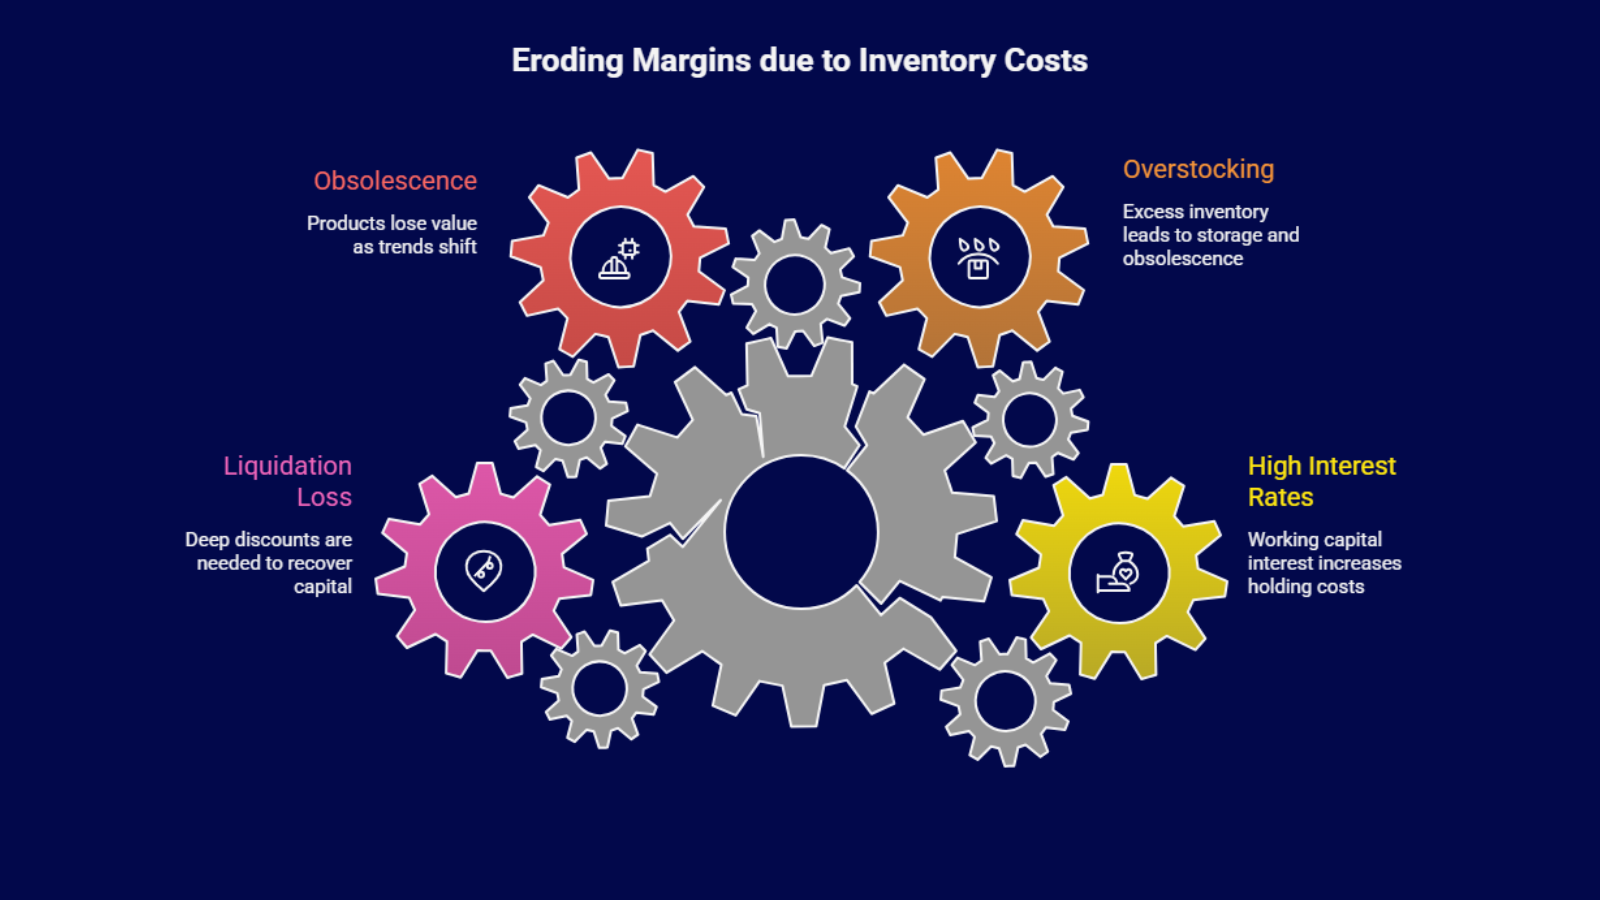
4. Inventory Holding Costs and Capital Blockage
The cost of holding stock is much higher than just warehouse rent. In the Indian context, where interest rates for working capital can range from 12% to 18%, every day a product sits on a shelf is an interest expense.
The True Cost of Overstocking
Indian sellers often overstock to avoid “Out of Stock” penalties on marketplaces or to prepare for festive sales like Diwali. However, holding excess inventory leads to:
- Storage Fees: Escalating costs for slow-moving SKUs in 3PL warehouses.
- Obsolescence: Products, especially in fashion or electronics, losing value as trends shift.
- Liquidation Loss: The need to run deep discounts (40-60% off) just to recover the principal capital.
5. Invisible Logistics: Surcharges and Non-Delivery Reports (NDR)
Standard shipping rates are just the baseline. The real hidden ecommerce costs lie in the surcharges. Fuel surcharges, “Remote Area Surcharges” for North-East or rural pin codes, and re-attempt charges can inflate a ₹70 delivery to ₹110 instantly.
Furthermore, poor NDR management, where a courier marks a delivery as “failed” without actually attempting it, leads to unnecessary RTOs. If a seller doesn’t have a dedicated team or tool to verify these failed attempts in real-time, they are essentially paying the courier to lose them money.
6. Ad Spend Wastage and Attribution Blindness
In 2026, Customer Acquisition Cost (CAC) has skyrocketed. Many Indian brands see a ROAS (Return on Ad Spend) of 4x on their dashboard and think they are profitable. However, that 4x ROAS is calculated on “Gross Sales.”
The “Net ROAS” Trap
When you factor in a 25% RTO and a 10% return rate, your “Net ROAS” drops from 4x to roughly 2.6x. If your product margins are thin, you might actually be losing money on every “successful” ad conversion. This is a classic example of margin erosion caused by ignoring the post-purchase reality in marketing calculations.
- High-intent keywords are becoming expensive, forcing brands to bid on broader terms that often attract “window shoppers” who prefer COD and have high RTO tendencies.
- Lack of server-side tracking leads to 15-20% data loss, making ad spend optimization a guessing game.
7. Packaging Inefficiency and Damage Claims
Packaging is often viewed as a branding expense, but it is a major operational cost. Over-packaging increases the volumetric weight (triggering higher shipping tiers), while under-packaging leads to “Damaged in Transit” claims.
In India, the “reverse journey” for a damaged product is rarely reimbursed by couriers unless the seller has expensive insurance or can provide “unboxing videos” from the customer, a logistical nightmare to manage at scale.
8. Technology Debt and Fragmented Data
As the brand grows, they add a warehouse management system (WMS), an order management system (OMS), a CRM, and various Shopify apps. Each of these carries a monthly subscription fee. More importantly, when these systems don’t “talk” to each other, it creates data silos.
The Cost of Manual Reconciliation
Finance teams in many Indian SMEs spend 10-15 days a month just reconciling marketplace settlements against bank statements. This manual labor is not just a salary expense; it is a source of error. Unclaimed “short settlements” or missing “Safe-T” claims (for damaged returns) are often forgotten, leading to direct cost leakage.
9. Customer Service Overhead for Post-Purchase Anxiety
Indian consumers have high “post-purchase anxiety,” particularly for prepaid orders. This leads to a barrage of “Where is my order?” (WISMO) calls and WhatsApp messages.
If a brand hasn’t automated their tracking updates, the cost of maintaining a large customer support team to answer basic queries eats into the net margin. Industry data suggests that a single customer support interaction can cost a brand between ₹15 and ₹40, depending on the channel.
10. Compliance and Regulatory Taxes
With the implementation of TCS (Tax Collected at Source) and TDS under the GST regime, e-commerce sellers face a complex tax landscape. While these are technically refundable or adjustable, they tie up significant cash flow.
Failure to reconcile GST input tax credits (ITC) on shipping invoices or marketplace fees is a common oversight. If your logistics partner doesn’t upload their invoices correctly to the GST portal, you lose the 18% credit, which directly hits your ecommerce profitability.
Bottom Line: Turning the Tide on Profitability
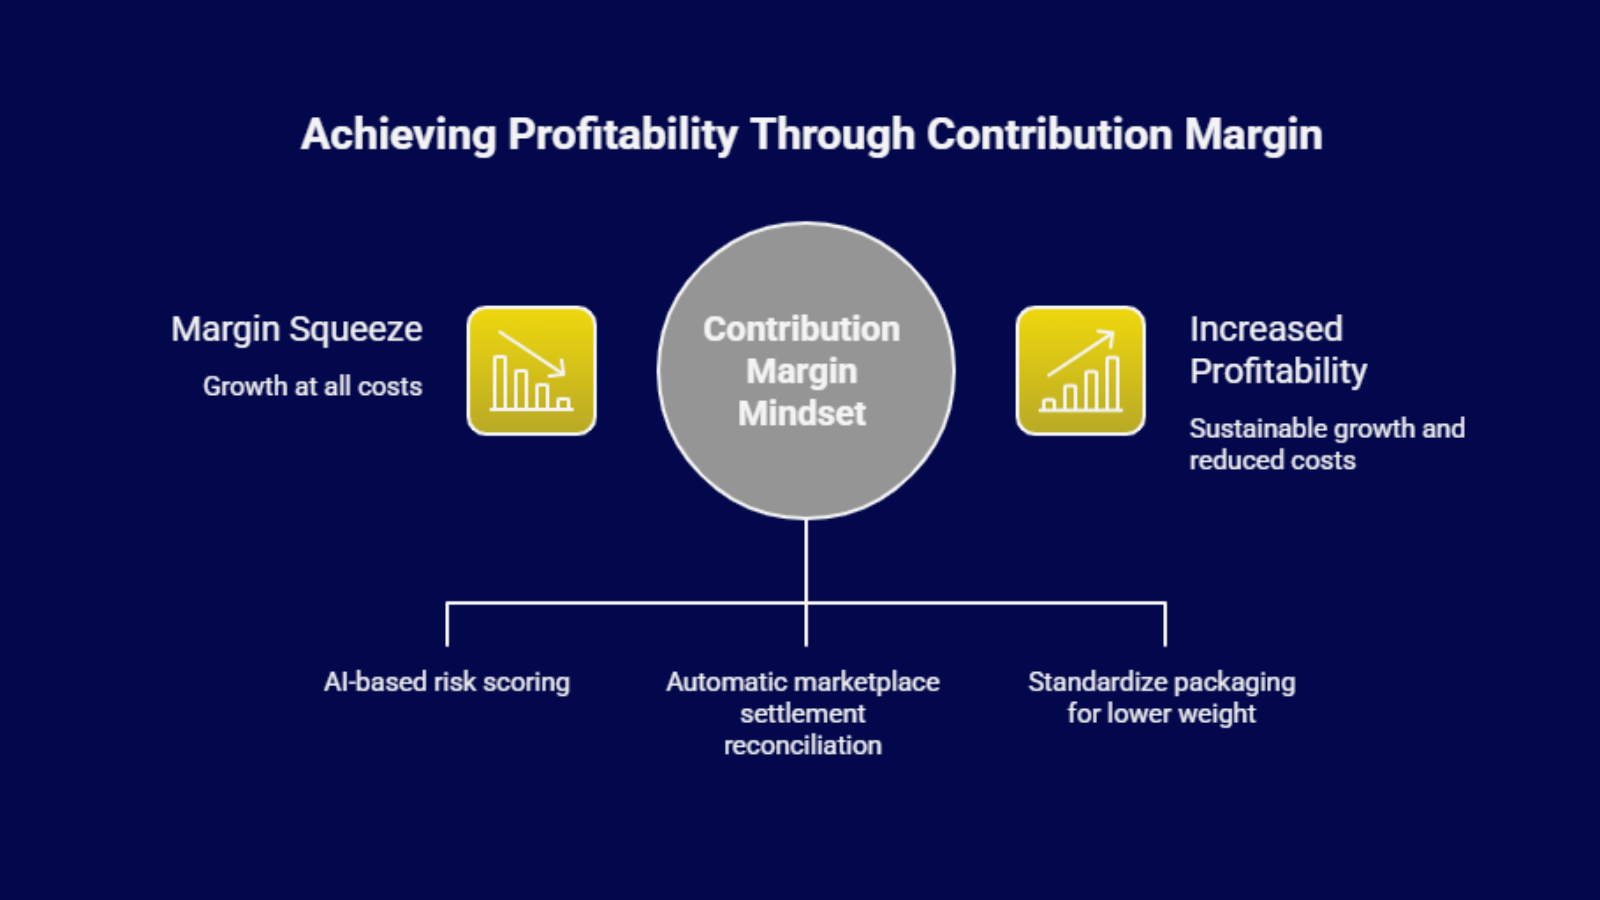
To survive the “margin squeeze” of 2026, Indian sellers must move from a growth-at-all-costs mindset to a Contribution Margin mindset. This involves tracking “CM3”, the profit remaining after COGS, marketing, fulfillment, returns, and all variable overheads.
| Strategy | Actionable Step | Expected Outcome |
|---|---|---|
| RTO Reduction | Use AI-based risk scoring for COD orders. | 15-20% reduction in failed deliveries. |
| Audit Automation | Reconcile every marketplace settlement automatically. | Recovery of 1-2% of revenue in missed claims. |
| Weight Management | Standardize packaging to fit lower weight slabs. | 5-10% saving on total shipping bill. |
If you are struggling to maintain visibility over these moving parts, you need a unified operating system. Base.com provides the comprehensive infrastructure needed to manage multi-channel operations, helping you plug these leaks and regain control over your bottom line.
Click here to understand how OMS can help to reduce RTOs.
Frequently Asked Questions (FAQs)
1. What is the biggest hidden cost for Indian e-commerce sellers?
The most significant hidden cost is Return to Origin (RTO). It involves paying for two-way shipping and packaging without generating any revenue. For many Indian D2C brands, RTO rates can hover between 20% and 30%, quietly destroying net profitability.
2. How does volumetric weight affect my shipping margins?
Couriers charge based on the greater of actual weight or volumetric weight. If your packaging is unnecessarily large, you may be paying for a 1kg slab while your product only weighs 400g. This discrepancy is a major source of cost leakage.
3. Why is COD more expensive than prepaid for a seller?
Beyond the higher RTO risk, logistics providers charge a COD collection fee to handle physical cash. Additionally, the administrative burden of managing cash settlements and the longer payment cycle creates significant working capital pressure compared to instant digital payments.
4. What is “reconciliation leakage” in marketplace selling?
This occurs when marketplaces deduct more than the agreed-upon fees or fail to reimburse for lost/damaged returns. Without automated tools, it is nearly impossible for sellers to spot these errors manually, leading to a loss of 1-3% of turnover.
5. Can ad spend be considered a hidden cost?
While the spend itself is visible, the inefficiency is hidden. If you don’t account for returns and RTOs in your ROAS calculations, you may be scaling “profitable” ads that are actually losing money on a net-settlement basis.