The early phase of building a D2C brand in India is anything but easy. Founders juggle product-market fit, supply chain chaos, ad experimentation, and cash flow pressure all at once. But once the first few campaigns begin converting and orders start coming in consistently, momentum builds. Customer acquisition appears manageable, dashboards show upward movement, and daily order notifications create a sense of validation.
At this stage, revenue becomes the loudest signal founders focus on, not because the journey is simple, but because growth feels tangible and measurable. The shift happens when scale kicks in.
As monthly sales cross a few crores, costs that once felt manageable start showing their real weight. Ads become more competitive, discounts deepen, logistics bills grow, and returns begin to chip away at margins. This is when Customer Acquisition Cost (CAC) vs Lifetime Value (LTV) moves from being a dashboard metric to a survival check.
For Indian sellers, understanding CAC and LTV for Indian D2C brands is not about complex financial modeling. It is about answering one clear question. Does every new customer strengthen the business, or does growth quietly weaken cash flow? When CAC keeps rising, but LTV does not improve at the same pace, growth becomes expensive momentum rather than durable progress.
This is why D2C metrics in India need to be viewed through a practical lens. Indian customers behave differently across categories, pin codes, and price points. Logistics and returns shape profitability as much as marketing does. When founders connect CAC and LTV to real operating costs and repeat behavior, they gain clarity on what growth is actually worth.
Why CAC vs LTV Matters More Than Revenue in Indian D2C
Revenue is the easiest number to celebrate. It grows quickly, looks impressive on dashboards, and creates the feeling that the brand is scaling correctly. But in Indian D2C, revenue alone is a vanity metric. It shows how fast money comes in, not how much actually stays.
India operates in a high-friction environment. Shipping costs vary sharply by zone. Tier 2 and Tier 3 deliveries cost more and take longer. COD increases RTO risk. Returns block inventory and delay cash inflows. Discounts are expected, not optional. In this ecosystem, ignoring CAC and LTV means confusing order volume with real strength.
A brand can double revenue from ₹5Cr to ₹10Cr and still feel cash pressure. Ad budgets need weekly top-ups. Vendor payments get delayed. Working capital feels tight. This usually happens when Customer Acquisition Cost rises faster than customer value.
What CAC Really Means in Indian D2C
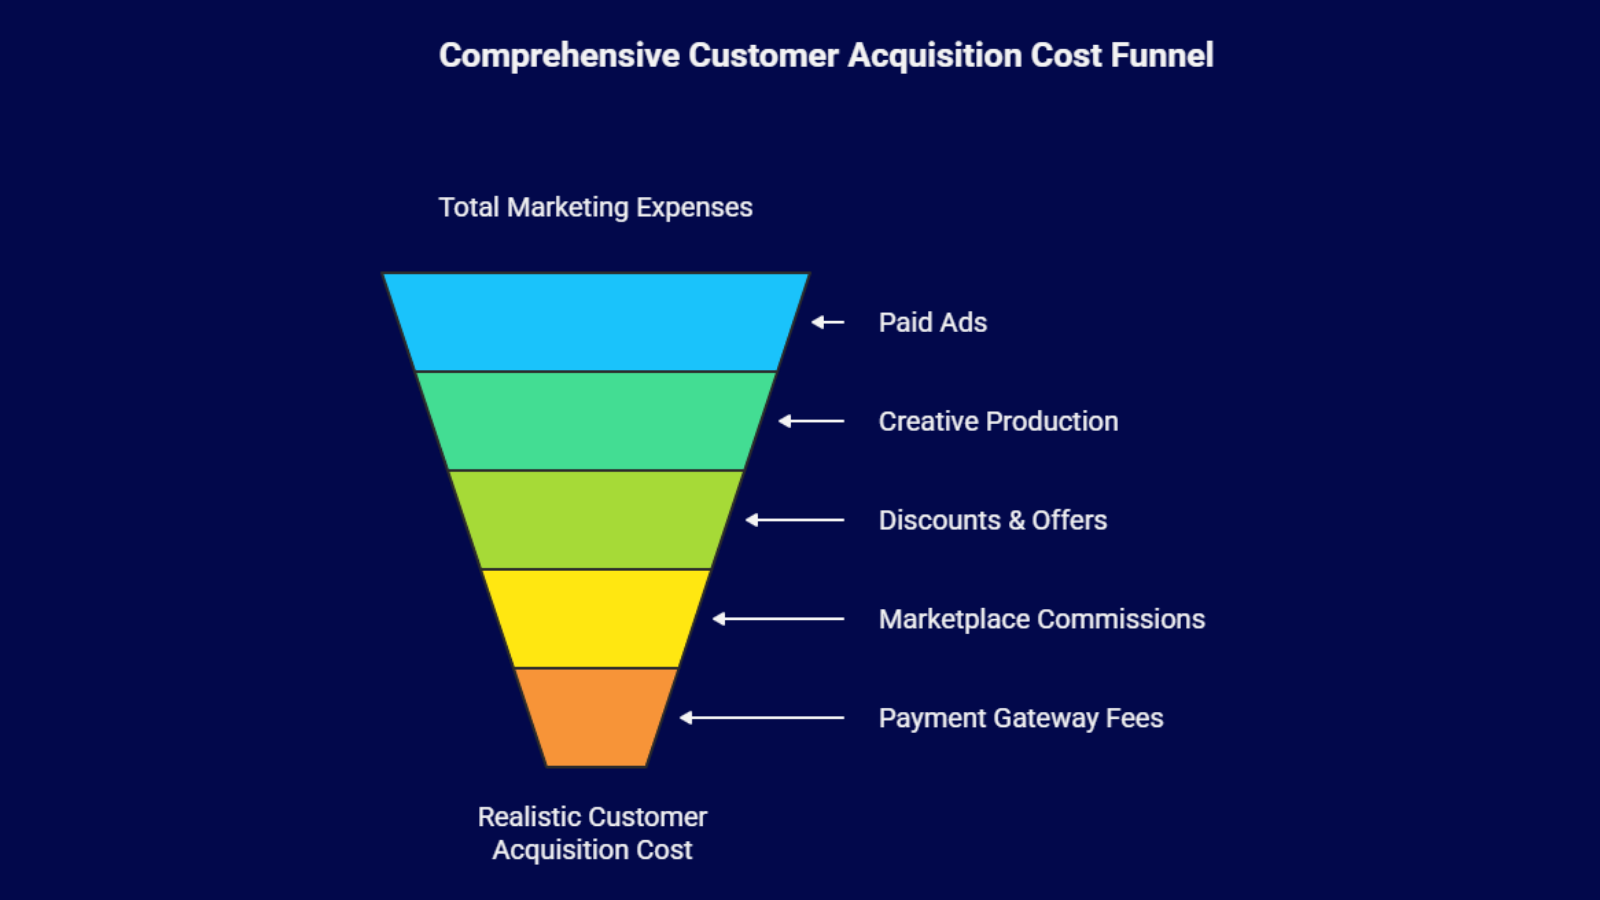 Customer Acquisition Cost is more than ad spend divided by new customers. In India, CAC must include every rupee spent to convert a first-time buyer.
A realistic CAC includes:
- Paid ads across Meta, Google, influencers, and affiliates
- Creative production and agency costs
- First-order discounts and cashback offers
- Marketplace commissions if discovery happened there
- Payment gateway fees on the first order
Example:
If ad spend alone is ₹16 lakh and 2,000 new customers are acquired:
Ad-only CAC = ₹16,00,000 ÷ 2,000 = ₹800 per customer
But if you also spent:
• ₹3 lakh on discounts
• ₹1 lakh on influencer payouts
• ₹50,000 on creative and gateway costs
Your actual acquisition spend is ₹20.5 lakh.
Real CAC = ₹20,50,000 ÷ 2,000 = ₹1,025 per customer
If founders calculate CAC using only ad spend, they may believe CAC is ₹800.
In reality, it is ₹1,025.
That ₹225 gap quietly distorts pricing decisions, contribution margins, payback periods, and scale assumptions.
What LTV Actually Means
Lifetime Value is not total revenue generated by a customer. It is the total contribution margin earned over their lifetime.
LTV formula in Indian D2C:
LTV = (Repeat Revenue – COGS – Shipping – Packaging – Payment Fees – Returns – RTO Losses)
For example:
If a customer makes 3 purchases of ₹1,000 each:
Total revenue = ₹3,000
COGS at 40% = ₹1,200
Shipping + reverse blended = ₹450
Payment + misc fees = ₹150
Contribution margin = ₹3,000 – ₹1,800 = ₹1,200
True LTV = ₹1,200, not ₹3,000.
If CAC is ₹800 and LTV contribution is ₹1,200, the ratio is 1.5:1. That is fragile. A healthy Indian D2C benchmark is at least 3:1 to comfortably absorb volatility.
CAC vs LTV Benchmarks for Indian D2C by Category
 Benchmarks act as a reality check for Indian D2C founders. They help teams understand whether growth is being bought too expensively or built on healthy fundamentals. Without benchmarks, CAC and LTV numbers exist in isolation and are hard to judge.
It is important to remember that CAC and LTV for Indian D2C brands‘ benchmarks are shaped by customer behavior, repeat purchase cycles, pricing sensitivity, and logistics complexity. Below are realistic category-wise benchmarks based on how Indian consumers actually buy and reorder.
1. Apparel and Fashion D2C Benchmarks
Fashion D2C brands in India typically enjoy higher repeat potential because customers return for new styles, colors, and seasonal collections. At the same time, fashion also suffers from high returns and exchange rates due to size and fit issues.
Typical benchmarks for Indian fashion brands:
- Average CAC ranges from ₹600 to ₹1,200
- 12-month LTV usually falls between ₹3,000 and ₹6,000
- A healthy LTV to CAC ratio sits between 3:1 and 5:1
Brands that invest in better size guides, fit consistency, and smooth exchange processes tend to perform better on CAC, LTV, and D2C India ratios. Reducing returns directly improves contribution margin and pushes LTV upward without increasing acquisition spend.
2. Beauty and Personal Care D2C Benchmarks
Beauty and personal care brands benefit from predictable consumption cycles. Products like skincare, haircare, and supplements naturally lend themselves to repeat buying, which makes LTV easier to build over time.
Typical benchmarks in this category:
- Average CAC between ₹400 and ₹900
- 12-month LTV between ₹4,000 and ₹8,000
- Healthy LTV to CAC ratio of 4:1 to 6:1
In D2C metrics in India, beauty brands with refill packs, subscriptions, and routine-based usage significantly outperform those that rely only on new product launches. Retention systems matter more than constant acquisition.
3. Food and Beverage D2C Benchmarks
 Food and beverage brands operate in a high-frequency but low-margin environment. Customers reorder often, but logistics and perishability put pressure on profitability.
Typical benchmarks for Indian food D2C:
- Average CAC between ₹300 and ₹700
- 12-month LTV between ₹2,000 and ₹4,500
- Healthy LTV to CAC ratio of 3:1 to 4:1
Here, CAC and LTV for Indian D2C brands are influenced more by fulfillment efficiency than by ad performance. Brands that optimize shipping zones, reduce delivery times, and control returns usually see better LTV outcomes.
4. Consumer Electronics and Accessories Benchmarks
Electronics and accessories brands face a different challenge. Purchase frequency is low, but average order values are higher. LTV depends heavily on cross-sells and add-ons.
Typical benchmarks include:
- Average CAC between ₹1,000 and ₹2,500
- 12-month LTV between ₹3,500 and ₹7,000
- Healthy LTV to CAC ratio of 2:1 to 3:1
Brands that introduce accessories, bundles, and upgrade paths improve D2C metrics in India significantly by extending customer value beyond the first purchase.
Why CAC Rises and LTV Is Harder to Build as Indian D2C Brands Scale
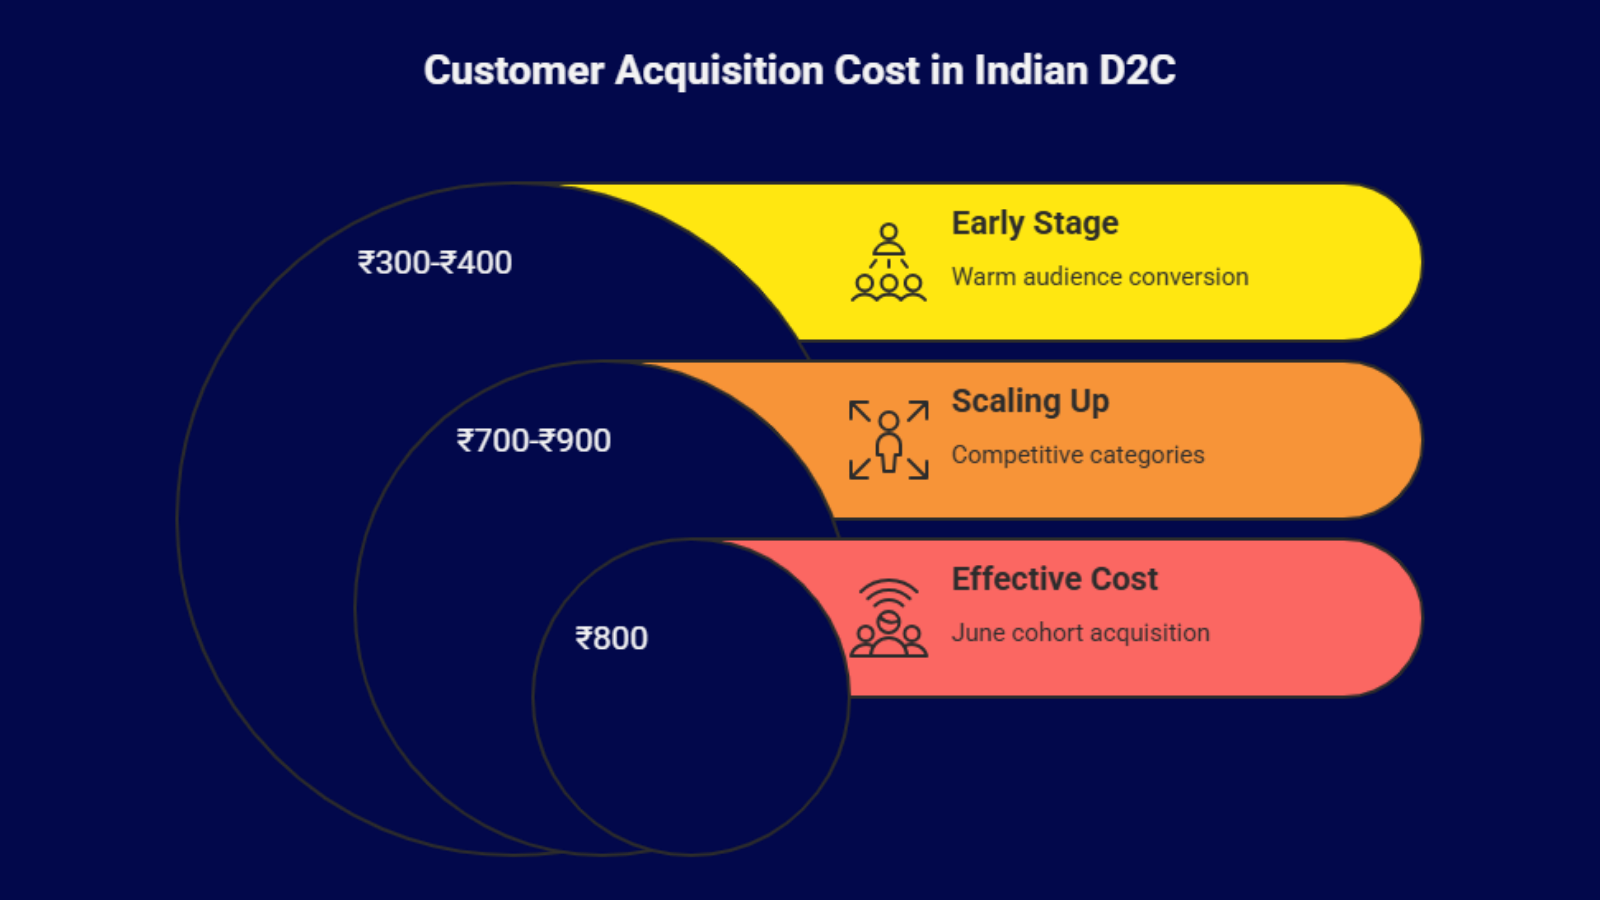 CAC is never fixed in Indian D2C. Early on, brands convert warm audiences at ₹300 to ₹400 CAC through referrals, influencers, and organic discovery. As scale increases, Meta CPMs rise, Google CPC inflates, and CAC can jump to ₹700 to ₹900 in competitive categories. To maintain conversion rates, brands increase discounts by 10 to 20 percent, further raising effective acquisition cost.
This is why CAC must be tracked by cohort. If January customers were acquired at ₹500 CAC with 35 percent repeat rate, but June cohorts cost ₹800 with only 20 percent repeat, scaling budgets will weaken economics. Aggregate CAC hides this stress.
LTV must be contribution-based, not revenue-based. Example:
Customer makes 3 purchases of ₹1,200 each = ₹3,600 revenue
COGS at 45% = ₹1,620
Shipping + reverse blended = ₹540
Payment + misc = ₹180
True contribution = ₹1,260
If CAC is ₹800, LTV:CAC = 1.6:1. That is fragile. Sustainable D2C benchmarks target at least 3:1.
Returns and RTO further distort economics. A 20 percent return rate with ₹120 forward and ₹100 reverse cost adds roughly ₹44 per shipped order in leakage. At 10,000 monthly orders, that is ₹4.4 lakh erosion.
In India, LTV improves only through operational strength: faster delivery, accurate size guides, low RTO below 8 percent, and repeat rates above 30 percent. Without this, rising CAC and overstated LTV create growth that looks strong but compounds risk.
Common CAC vs LTV mistakes Indian D2C brands make
- Calculating LTV on revenue instead of contribution margin
- Ignoring shipping, packaging, and payment gateway costs
- Overlooking returns, exchanges, and RTO losses
- Treating CAC as a single blended number across channels
- Excluding discounts and first-order offers from CAC
- Assuming all customers behave the same over time
- Averaging strong and weak cohorts together
- Scaling ad spend before validating repeat purchase behavior.
Avoiding these mistakes improves CAC and LTV for Indian D2C brands without increasing marketing spend. In many cases, clarity itself becomes the biggest growth lever. When teams see accurate numbers, decisions around growth, pricing, and retention become far more disciplined and effective.
Turning CAC vs LTV Into an Operating System With the Right Tools
 Indian D2C brands do not fail because they lack data. They struggle because the data does not connect to daily decisions. CAC and LTV often sit in reports, while teams continue to scale ads, push discounts, and expand catalogs without seeing the downstream impact. This is where CAC vs LTV needs to move from a ratio into an operating system.
The goal of CAC and LTV for Indian D2C brands tracking is not reporting. It is an early warning. Brands that win can spot stress before it shows up in cash flow or vendor pressure. This requires a small set of metrics that are tracked consistently and reviewed together.
What Indian D2C teams should track weekly?
- CAC by channel and campaign to identify where acquisition is becoming inefficient
- LTV by acquisition cohort to measure customer quality over time
- Payback period to understand cash flow risk
- Contribution margin per order to see real profitability
- Repeat purchase rate to assess retention health.
When tracked together, these metrics explain not just what is happening, but why it is happening.
| Metric | What it helps founders understand |
|---|---|
| CAC by channel | Which platforms or campaigns are inflating acquisition costs |
| LTV by cohort | Whether newer customers are as valuable as older ones |
| Payback period | How long is it locked before recovering the CAC |
| Contribution margin per order | True profitability after logistics and returns |
| Repeat purchase rate | Strength of retention and product trust |
As brands scale, manual tracking starts breaking down. Inventory, shipping, returns, and customer data often sit in separate tools, which quietly hurts LTV while pushing CAC higher. Platforms that centralize these workflows help teams act on D2C metrics in India in real time, instead of reacting after margins are already damaged.
This is where systems stop being optional and start becoming a growth advantage.
Base.com helps Indian D2C brands strengthen CAC vs LTV by fixing the layers beneath growth. By unifying order and inventory data, reducing fulfillment delays, optimizing shipping costs by zone, improving post-purchase experience, and removing operational friction, Base.com enables CAC to become more efficient while LTV compounds naturally. If you are scaling and want clarity on CAC and LTV for Indian D2C brands, Base.com helps turn numbers into decisions, not just reports.
FAQs
1. What is a good CAC for Indian D2C brands?
A good CAC depends on the category, pricing, and repeat purchase behavior. Most Indian D2C brands operate between ₹400 and ₹1,200 CAC. What matters more is whether LTV comfortably exceeds CAC within a reasonable payback period.
2. How do Indian D2C brands calculate LTV correctly?
LTV should be calculated using contribution margin, not revenue. Product cost, shipping, packaging, payment gateway fees, and return losses must be included. This approach gives realistic CAC and LTV for Indian D2C brands insights and avoids inflated customer value.
3. Why is LTV lower than expected for many Indian D2C brands?
LTV drops due to delayed deliveries, high returns, inconsistent product quality, and weak post-purchase engagement. Improving D2C metrics in India usually requires operational fixes rather than increasing marketing spend.
4. How long should CAC payback take in Indian D2C?
A healthy CAC payback period is typically between three and six months for most Indian D2C categories. Longer payback periods increase cash flow risk, especially in discount-heavy Indian markets.
5. Can CAC vs LTV improve without increasing ad spend?
Yes. Better retention, reduced returns, improved logistics, and higher repeat contribution can significantly improve CAC and LTV for Indian D2C brands without spending more on customer acquisition.