
Quick commerce has rapidly changed how urban India buys everyday essentials. Platforms like Blinkit, Zepto, and Swiggy Instamart promise delivery in 10–15 minutes, but the economics behind this speed are far more complex than most sellers expect.
In India, the average quick commerce order value ranges between ₹400 and ₹700, yet platform commissions alone can reach 18–25 percent. When you add the typical delivery cost per order of ₹40–₹60 and promotional discounts needed to win visibility on the app, margins shrink quickly.
Many Indian D2C brands assume quick commerce behaves like marketplace ecommerce. In reality, shelf placement, stock availability inside dark stores, and paid search placements directly influence sales velocity. For example, brands often spend ₹80–₹150 per order on ads during launch campaigns, pushing quick commerce CAC higher than expected.
Understanding quick commerce unit economics, q-commerce contribution margin, delivery cost per order, quick commerce CAC, and D2C profitability metrics is essential before scaling inventory across multiple dark store clusters.
What Quick Commerce Unit Economics Actually Means for Indian Brands
At its core, quick commerce unit economics answers a simple question: Does a single order make money after covering all direct costs? If the answer is no, scaling sales only increases losses. Many Indian D2C brands misunderstand this when they launch on platforms like Blinkit, Zepto, or Swiggy Instamart.
Unlike traditional ecommerce where orders ship from large warehouses, quick commerce depends on hyperlocal dark stores. Each order must be picked, packed, and delivered within 10–15 minutes from a nearby fulfillment hub. This speed increases operational costs significantly. According to industry estimates, dark store operations alone consume around 7–10% of average order value, while delivery logistics add another major cost layer.
For Indian sellers, this becomes even more critical because the average quick commerce basket size in India is only ₹450–₹700. That means every cost component eats into already thin margins.
This is why brands must track quick commerce unit economics at the order level.
Key Components of Quick Commerce Unit Economics
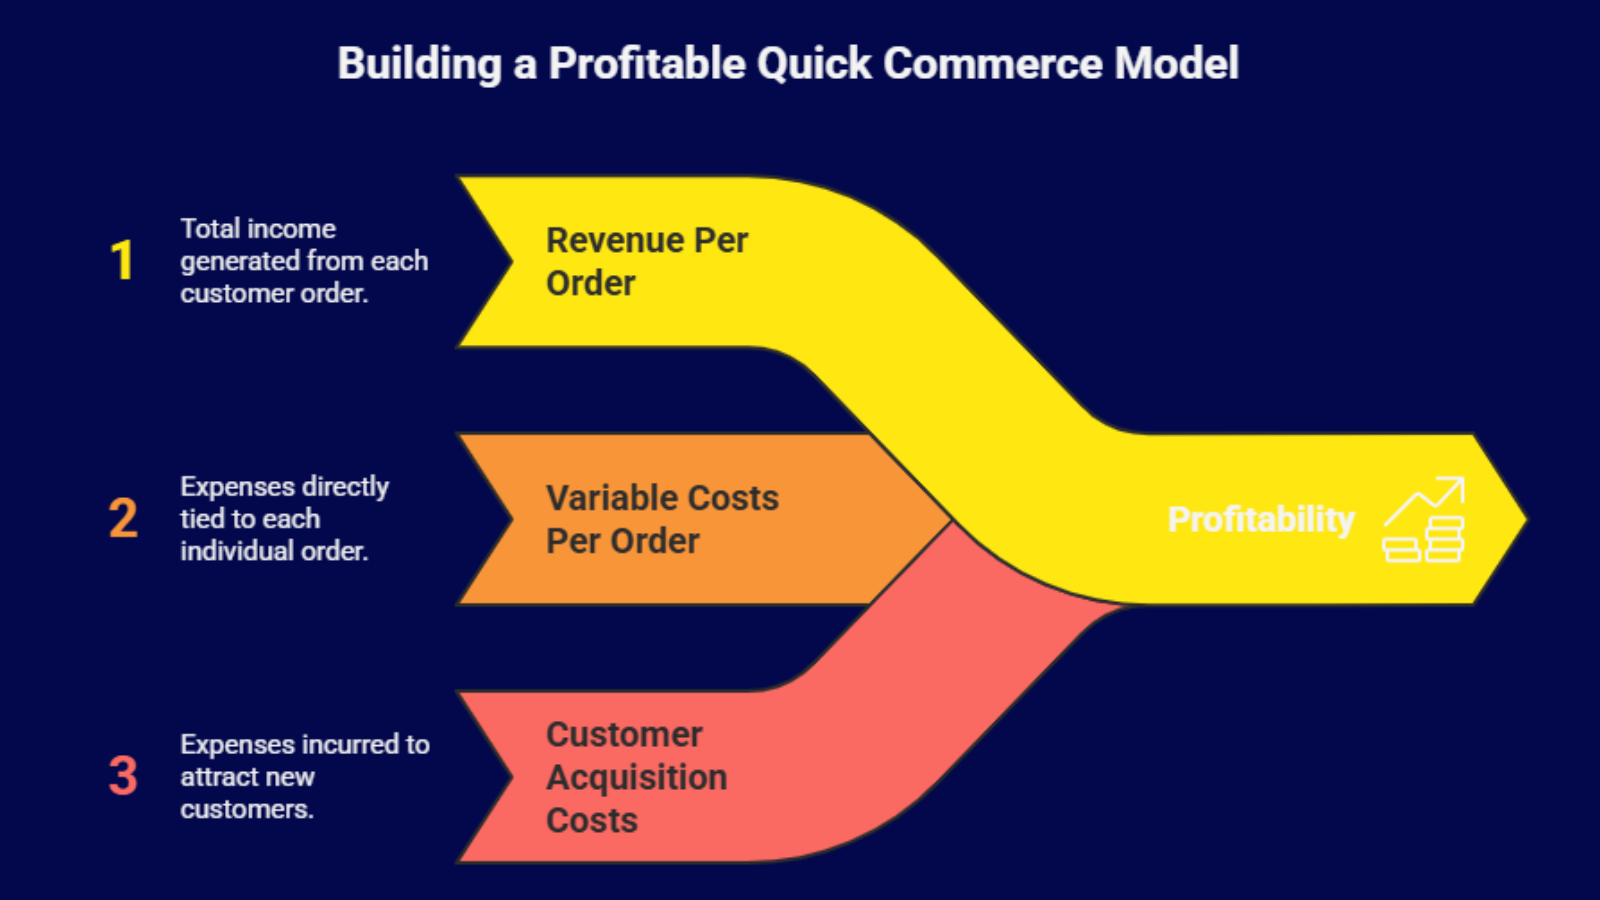 Indian sellers often underestimate how many variables affect profitability. The key components include:
1. Revenue Per Order
Revenue is not just the product price. It may include multiple elements.
- Product selling price on the platform
- Platform incentives during launch periods
- Delivery fees are charged to customers in some locations
For example, if a snack brand sells a ₹199 product on Blinkit, the actual realized revenue may drop after discounts are applied by the platform.
2. Variable Costs Per Order
These are the costs that directly increase with each order.
- Platform commission: typically 18–25% of product value
- Picking and packing inside dark stores
- Delivery cost per order, usually ₹40–₹60 in urban India
- Packaging and handling charges
- Return or damaged product costs
For a ₹500 order, platform commission alone can remove ₹90–₹120 from revenue.
3. Customer Acquisition Costs
Many brands overlook this cost completely when calculating quick commerce profitability.
- Sponsored product ads
- Category banner placements
- Flash sale promotions
- App visibility campaigns
During product launches, quick commerce CAC can reach ₹80–₹150 per order for Indian brands trying to rank in search results.
4. Contribution Margin
The most important number is the q-commerce contribution margin.
Contribution margin = Revenue per order – variable costs
If a brand earns ₹180 product margin on a ₹600 order but spends ₹200 across commission, delivery, and ads, the order becomes loss-making.
Real Cost Structure of a Quick Commerce Order
For most Indian sellers, the typical cost distribution looks like this:
| Cost Component | Typical Share of Order Value |
|---|---|
| Platform commission | 15–25% |
| Delivery cost per order | ₹40–₹60 |
| Dark store operations | 7–10% |
| Packaging and handling | 3–5% |
| Promotions and ads | 10–20% |
A practical example explains the challenge.
- Order value: ₹600
- Platform commission (20%): ₹120
- Delivery cost per order: ₹50
- Promotions and ads: ₹60
The platform may generate around ₹120 in revenue but incur about ₹132 in fulfillment costs, creating a contribution loss.
For Indian sellers expanding into quick commerce, this highlights a critical truth. Tracking quick commerce CAC is the only way to scale sustainably.
Without carefully monitoring these numbers, brands may see rising sales but declining profitability.
Why Most Brands Miscalculate Quick Commerce Profitability
Many Indian brands enter quick commerce expecting fast revenue growth. Platforms like Blinkit and Zepto can generate high-order velocity within weeks of listing. However, growth often hides weak, quick commerce unit economics. When brands do not calculate D2C profitability metrics properly, they mistake revenue growth for profitability.
Below are the most common calculation mistakes Indian sellers make and how to fix them.
1. Miscalculating Delivery Cost Per Order
 Most brands assume delivery is fully handled by the platform and does not affect their margins. In reality, delivery cost per order indirectly impacts commissions, platform pricing, and promotional structures.
In metro cities like Bangalore and Delhi, the typical delivery cost ranges between ₹40 and ₹60 per order, depending on distance and rider utilization.
Common mistake
Brands calculate margin only on the product price minus commission.
Example
Product price: ₹300
Platform commission (20%): ₹60
Brand margin: ₹120
On paper, this looks profitable. But if promotions and delivery-linked charges are included, the actual margin can drop below ₹30.
Metrics to track
- Delivery cost per order vs average order value
- Delivery cost percentage of AOV
- Orders per dark store cluster
How to fix it
- Focus inventory in high-demand dark store clusters rather than spreading stock across many locations
- Target zones where order density exceeds 25–30 orders per hour, which improves delivery efficiency
- Increase bundle packs so delivery cost spreads across more items
2. Underestimating Quick Commerce CAC
Customer acquisition on quick commerce platforms is often far higher than brands expect.
Visibility on platforms like Blinkit and Instamart depends heavily on paid search placements and sponsored listings. During category launches, brands often spend ₹80–₹150 per order in advertising.
Common mistake
Brands only track platform sales and ignore advertising spend linked to those orders.
Example scenario
Order value: ₹450
Product margin: ₹180
Sponsored listing spend: ₹100
Actual profit becomes extremely thin or negative.
Metrics to track
- Quick commerce CAC per order
- Ad spend as a percentage of revenue
- Conversion rate from sponsored listings
How to fix it
- Run ads only on top-performing SKUs instead of full catalog promotion
- Pause campaigns where CAC exceeds product margin
- Use promotional bursts only during high-demand events, such as weekend grocery spikes
3. Ignoring Contribution Margin at SKU Level
 Many brands calculate profitability at the category level instead of the SKU level. But quick commerce demand is extremely SKU-specific.
For example, a beverage brand may sell a ₹99 energy drink profitably, while its ₹249 multipack loses money due to higher commissions and storage costs.
Metrics to track
- Q-commerce contribution margin per SKU
- Margin after discounts and ads
- SKU-wise sales velocity per dark store
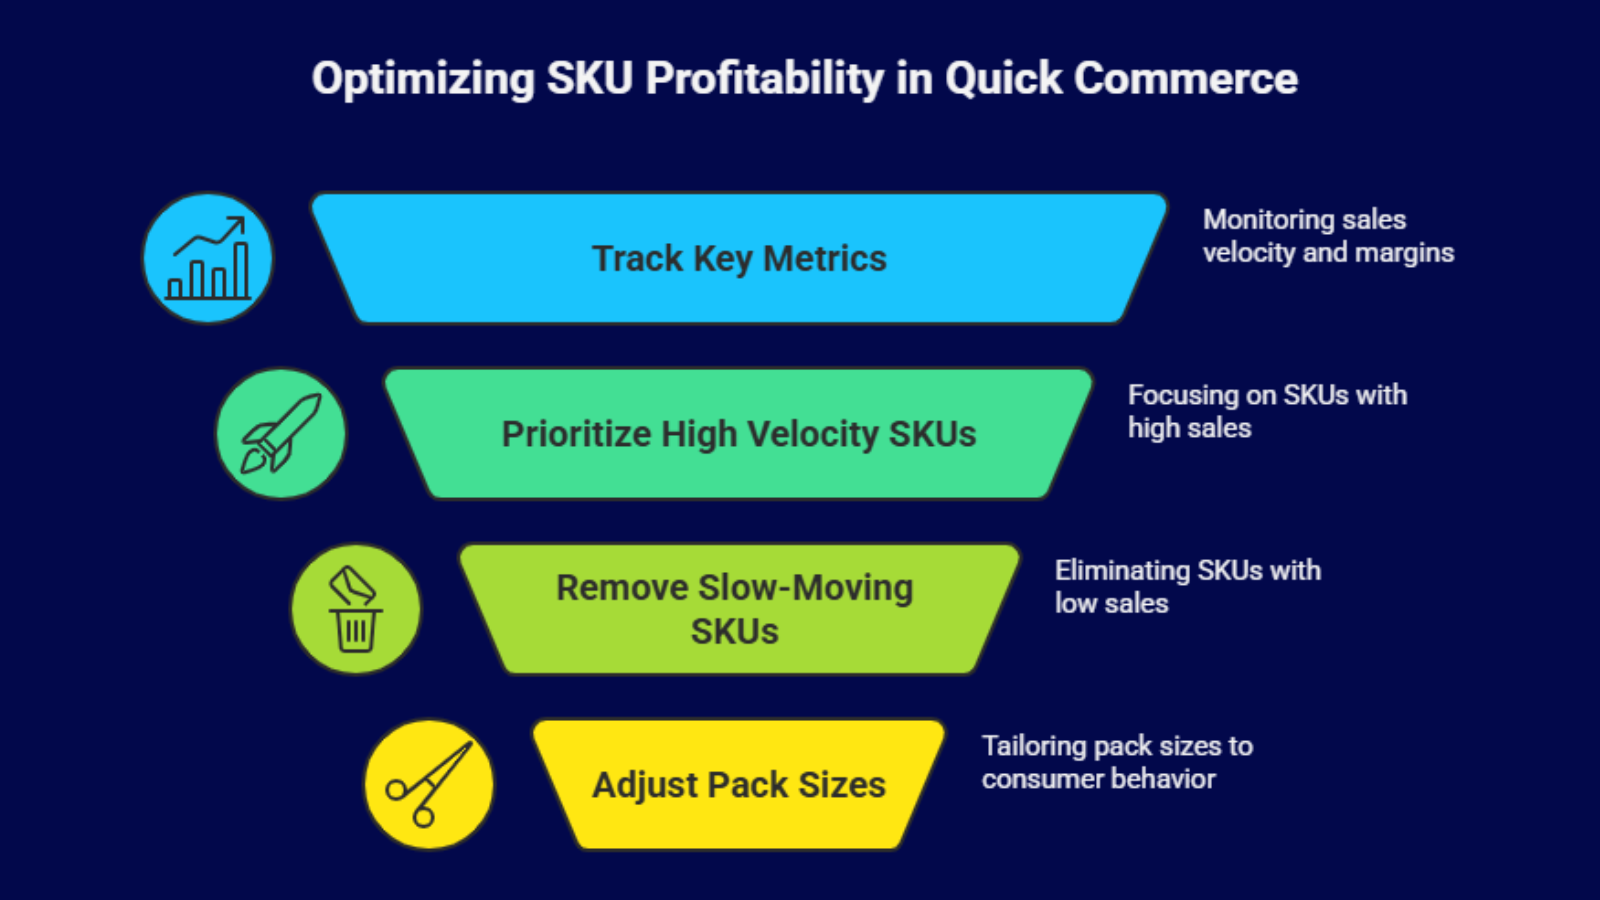
How to fix it
- Prioritize high velocity SKUs that sell at least 8–10 units per store per day
- Remove slow-moving SKUs that increase storage and spoilage risk
- Adjust pack sizes for quick commerce consumption behavior
4. Focusing Only on GMV Instead of Order Economics
Many brands celebrate monthly GMV growth without evaluating order-level profitability.
A brand generating ₹1 crore in quick commerce GMV may still lose money if margins are weak.
Metrics to track
- Gross margin after platform commissions
- Net contribution margin per order
- Revenue per dark store
How to fix it
- Build dashboards tracking quick commerce unit economics per order
- Set a minimum contribution margin target of 15–20% after commissions
- Limit discounting if the contribution margin falls below this threshold
5. Ignoring Repeat Purchase Economics
 Quick commerce works best when customers reorder frequently. Many brands overspend on acquiring first-time buyers but fail to convert them into repeat customers.
In grocery categories, repeat purchase cycles are often 7–14 days.
Metrics to track
- Repeat purchase rate
- Customer lifetime value vs quick commerce CAC
- Average reorder interval
How to fix it
- Promote habit-forming products such as snacks, beverages, or staples
- Offer bundle discounts to encourage larger baskets
- Maintain high stock availability because out-of-stock products lose ranking and repeat demand
When brands consistently monitor quick commerce unit economics and D2C profitability metrics, they move from growth at any cost to sustainable scaling.
For Indian sellers, profitability in quick commerce is not about selling more products. It is about ensuring every order contributes positively to the business.
A Real Example of Quick Commerce Unit Economics in Practice
To understand how quick commerce unit economics actually work, consider the case of a growing Indian snack brand called SnackRush, a D2C brand that expanded rapidly through Blinkit and Zepto in Bangalore and Gurgaon.
During its first three months on quick commerce platforms, SnackRush focused heavily on visibility. The brand launched a ₹199 healthy snack combo pack and invested aggressively in sponsored placements.
Here is how the economics looked for a typical order.
| Metric | Value |
|---|---|
| Order value | ₹199 |
| Platform commission (22%) | ₹44 |
| Delivery cost per order | ₹50 |
| Packaging and handling | ₹12 |
| Ads and promotions | ₹70 |
| Product cost | ₹80 |
Total cost reached ₹256, while revenue per order was only ₹199. This meant the brand was losing about ₹57 per order, even though sales volume was growing fast.
The biggest issue was quick commerce CAC. SnackRush spent around ₹70 per order on sponsored listings to rank in the top three search results for “healthy snacks”. Their ROAS was only 2.8x, which was not sustainable given their product margins.
The brand then reworked its strategy using a better understanding of the q-commerce contribution margin.
Instead of pushing single SKUs, SnackRush introduced bundle packs priced at ₹349. This increased the average order value and improved the contribution margin.
The new economics looked like this.
| Metric | Value |
|---|---|
| Order value | ₹349 |
| Platform commission | ₹77 |
| Delivery cost per order | ₹50 |
| Ads and promotions | ₹60 |
| Product cost | ₹140 |
Contribution margin improved significantly because the delivery cost per order stayed constant while the order value increased.
The brand also optimized marketing.
Key changes included
- Reducing ad spend to maintain ROAS above 4.5x
- Running ads only during evening snack demand hours
- Promoting high-repeat SKUs instead of full catalog listings
Within six months, the repeat purchase rate increased from 18 percent to 42 percent, which reduced quick commerce CAC significantly.
For Indian sellers entering quick commerce, this example highlights an important lesson. Success does not come from listing products alone. It comes from constantly optimizing quick commerce unit economics while aligning pricing, marketing, and inventory with how customers actually shop on quick commerce platforms.
Why the Future of Quick Commerce Depends on Unit Economics
The quick commerce industry in India is entering a new phase. For the first few years, most platforms focused on growth. The goal was simple: increase order volume, expand dark store networks, and capture urban demand. Today, the focus has shifted. Platforms and investors are now pushing for stronger profitability and better operational efficiency.
India’s quick commerce market is expected to cross $9–10 billion by 2028, but sustainable growth will depend heavily on improving D2C profitability metrics. Platforms like Blinkit, Zepto, and Swiggy Instamart have already started tightening discounting and prioritizing high-margin categories.
This shift directly affects brands selling on these platforms.
 Unlike traditional ecommerce marketplaces, quick commerce runs on hyperlocal logistics networks. Every order must move from a nearby dark store, be picked in minutes, and delivered within a short radius. That means profitability depends on operational precision across inventory, pricing, marketing, and delivery efficiency.
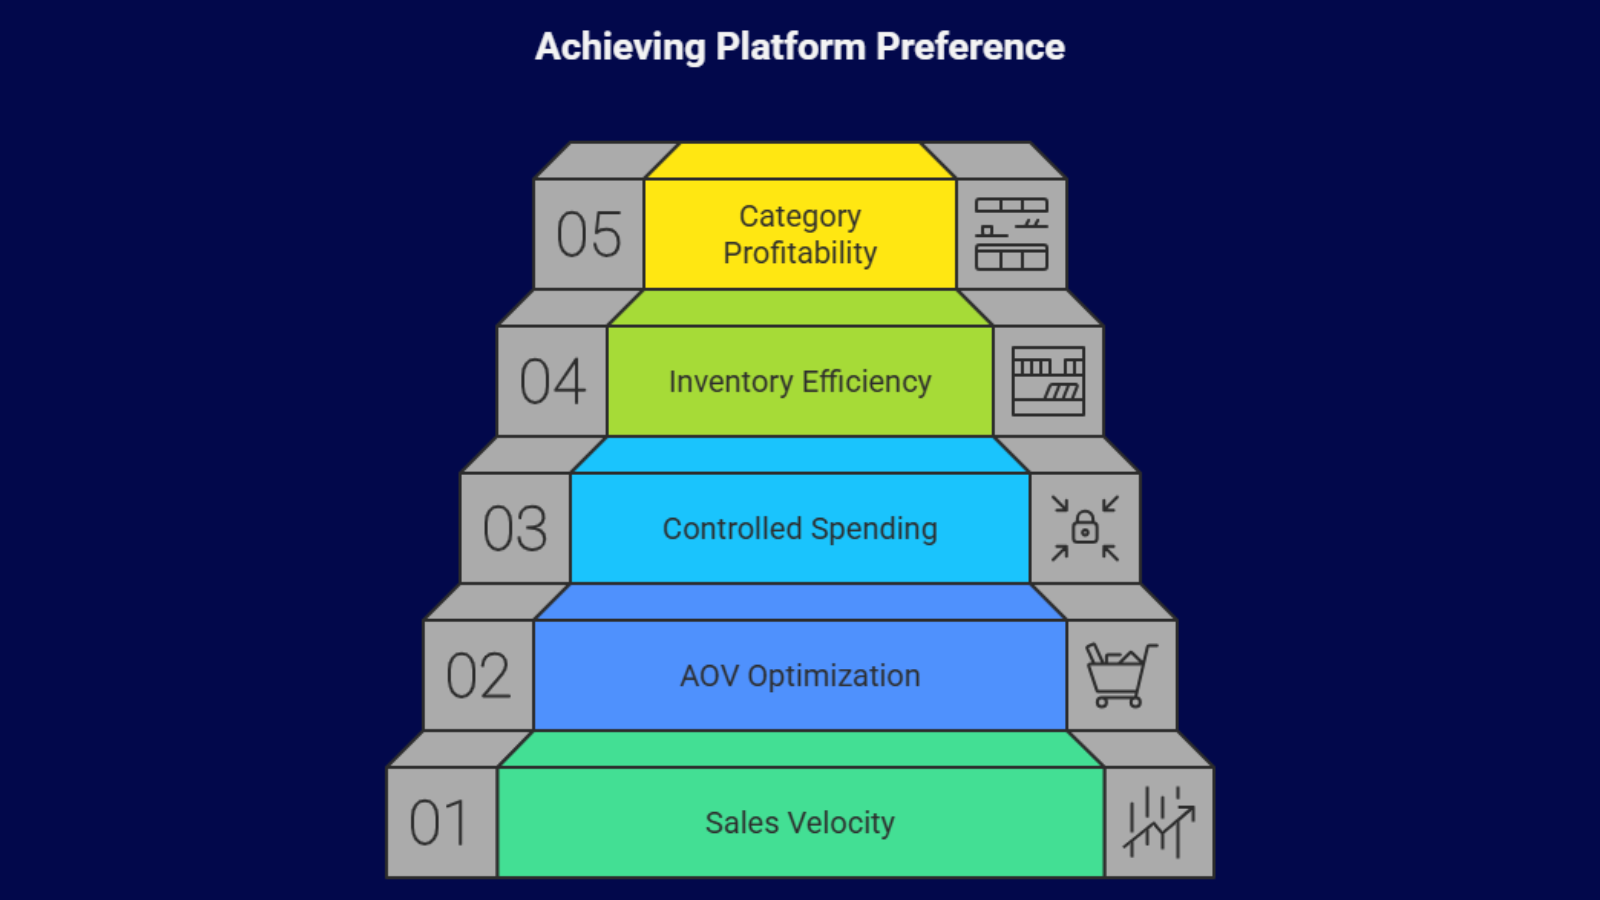
For Indian D2C sellers, several operational factors now determine success.
Dark store sales velocity
Brands that move at least 8–12 units per SKU per day per store usually maintain better shelf visibility and ranking.
Average order value optimization
Platforms prefer brands that push basket sizes above ₹350–₹400, because higher AOV improves delivery economics.
Controlled promotional spending
Many brands previously spent 20–30% of revenue on ads. Today, platforms reward brands that maintain healthier contribution margins.
Inventory efficiency across clusters
Stockouts reduce product ranking and algorithm visibility. Even a 24-hour stock gap can reduce sales velocity by 30–40%.
Category-level profitability focus
High-frequency categories such as snacks, beverages, instant foods, and personal care perform better because repeat purchase cycles are shorter.
This is why tracking quick commerce unit economics has become essential. The brands that win in quick commerce are not always the ones with the most SKUs or the biggest marketing budgets. They are the brands that understand operational math at the order level.
In the coming years, quick commerce will reward brands that combine strong demand with disciplined economics.
How Base.com Helps Brands Optimize Quick Commerce Profitability
For most Indian brands, the biggest challenge in quick commerce is not demand. It is visibility into the right numbers. Sales data, ad performance, inventory movement, and contribution margins often sit across multiple dashboards, making it difficult to understand real profitability.
This is where platforms like Base.com become valuable.
Base.com helps brands centralize and analyze operational data across marketplaces and commerce channels. Instead of manually tracking spreadsheets and dashboards, brands can monitor performance metrics in one place and make faster decisions.
When selling on quick commerce platforms, this visibility is crucial for improving quick commerce unit economics.
1. Unified performance tracking
Brands can track sales performance, inventory availability, and product demand across different channels. This helps teams quickly identify which SKUs are driving revenue and which ones are affecting contribution margins.
2. Better inventory management
Stockouts on quick commerce platforms directly affect ranking and repeat demand. Base.com helps brands monitor inventory levels and optimize replenishment cycles across multiple dark store clusters.
3. Marketing performance insights
Advertising spend on quick commerce platforms can quickly increase quick commerce CAC. Base.com helps brands evaluate campaign performance and optimize spending based on real return on ad spend data using Base Analytics.
4. Order-level profitability visibility
Instead of relying only on revenue reports, brands can evaluate q-commerce contribution margin and delivery cost per order to understand whether each SKU is profitable.
5. Operational efficiency for scaling
As brands expand to more cities and dark stores, managing data complexity increases. Base.com simplifies operations by giving teams better control over sales analytics, inventory flows, and marketplace integrations.
For Indian D2C brands expanding into quick commerce, growth alone is not enough. Sustainable success comes from understanding quick commerce unit economics and making decisions based on those numbers.
Platforms like Base.com help brands move from reactive decision-making to data-driven scaling. Instead of guessing which products or campaigns are working, teams can focus on building a profitable quick commerce strategy backed by real insights.
FAQs
1. What are quick commerce unit economics?
Quick commerce unit economics measure the profitability of a single order. It compares revenue per order with direct costs such as delivery, commissions, promotions, and fulfillment to determine whether each order generates profit or loss.
2. Why is the delivery cost per order so important?
Delivery cost per order is a major expense in quick commerce because orders are delivered within minutes. If the order value is low, delivery costs can quickly eliminate margins and make each order unprofitable.
3. What is the q-commerce contribution margin?
Q-commerce contribution margin is the revenue left after deducting variable costs like delivery, packaging, and platform fees. This margin must cover fixed expenses such as warehousing, marketing teams, and operations.
4. How does quick commerce CAC affect profitability?
Quick commerce CAC represents the cost of acquiring a customer through ads, discounts, and promotions. If CAC is too high and repeat purchases are low, brands struggle to recover their acquisition costs.
5. What are the most important D2C profitability metrics in quick commerce?
Key D2C profitability metrics include contribution margin, average order value, delivery cost per order, customer acquisition cost, and repeat purchase rate. Together, they define whether the quick commerce channel is sustainable.