India’s ecommerce RTO rates average 20-30% for prepaid and 30-40% for COD orders in 2026, with significant variation by category, courier, and geography.
Order accuracy benchmarks sit at 85-92% for brands without bin-level WMS, and above 98% for brands on automated fulfilment platforms. This report covers verified benchmarks across RTO, fulfilment SLA, and warehouse accuracy for Indian D2C and marketplace sellers.
Why Indian Ecommerce Benchmarks Matter in 2026
India’s ecommerce market crossed USD 226B in gross merchandise value in 2025, with D2C growing at 40% CAGR`. Understanding how to reduce RTO in India is now a boardroom priority, not just an ops team concern.
Growth has not meant efficiency. The average Indian D2C brand still processes orders manually, runs fragmented inventory across channels, and monitors RTO reactively rather than predictively. The gap between top-quartile and bottom-quartile operators on every benchmark metric has widened over the past two years.
This report gives ops teams, founders, and category managers a single reference point: what the best-performing Indian ecommerce brands actually achieve, and what the industry average looks like today.
1. RTO Benchmarks by Category – India 2026
 The ability to reduce RTO in India is the single highest-ROI operational lever available to D2C brands. The brands that have cracked how to reduce RTO in India consistently outperform peers on contribution margin by 8-15%. A 5 percentage point reduction in RTO on 1,000 daily COD orders saves approximately ₹75,000-₹1,20,000 per month in reverse logistics alone.
RTO Rates by Product Category
| Category | Average RTO Rate (COD) | Average RTO Rate (Prepaid) | Primary RTO Cause |
|---|---|---|---|
| Fashion and apparel | 35-45% | 18-24% | Size mismatch, address failure |
| Beauty and personal care | 28-35% | 14-18% | Customer unavailability |
| Electronics and accessories | 22-28% | 10-14% | Pin code unserviceability |
| Health and wellness | 25-32% | 12-16% | COD preference in Tier-3 |
| Home and kitchen | 30-38% | 15-20% | Fragile damage, wrong item |
| Footwear | 38-48% | 20-26% | Fit issues, no try-before-buy |
| Books and stationery | 10-15% | 5-8% | Low COD share, high address accuracy |
| FMCG and grocery | 15-22% | 8-12% | Repeat buyer base, predictable addresses |
Fashion and footwear face the highest RTO burden in India, driven by size uncertainty and high COD dependency in Tier-2 and Tier-3 cities. Brands in these categories that implement size recommendation tools, COD risk scoring, and proactive NDR workflows consistently reduce RTO in India rates by 10-15 percentage points.
The most effective way to reduce RTO in India in fashion is to combine checkout-level size guidance with post-dispatch NDR automation, not choose one or the other.
Base.com’s COD eligibility engine allows brands to set pin code-level, order-value-level, and customer-history-level rules that automatically decline or nudge COD orders above a defined risk threshold, without removing COD access entirely.
RTO by Tier, Metro vs Non-Metro
| Geography | Average RTO Rate | First Attempt Delivery Success |
|---|---|---|
| Metro cities (Top 8) | 18-24% | 72-78% |
| Tier-1 cities | 24-30% | 65-72% |
| Tier-2 cities | 30-38% | 58-65% |
| Tier-3 and rural | 38-50% | 45-58% |
Tier-3 and rural geographies account for a disproportionate share of total RTO volume for D2C brands running pan-India fulfillment. Reducing RTO India in these geographies requires courier selection, proactive buyer outreach post-dispatch, and address verification at checkout.
Brands that want to reduce RTO in India in Tier-3 must also invest in vernacular SMS communication. Hindi, Tamil, Telugu outreach has shown 18-22% better re-delivery response rates than English messages in non-metro geographies. A 10% improvement in Tier-3 first-attempt delivery typically improves overall brand RTO by 3-5 percentage points.
2. Fulfilment SLA Benchmarks by Channel
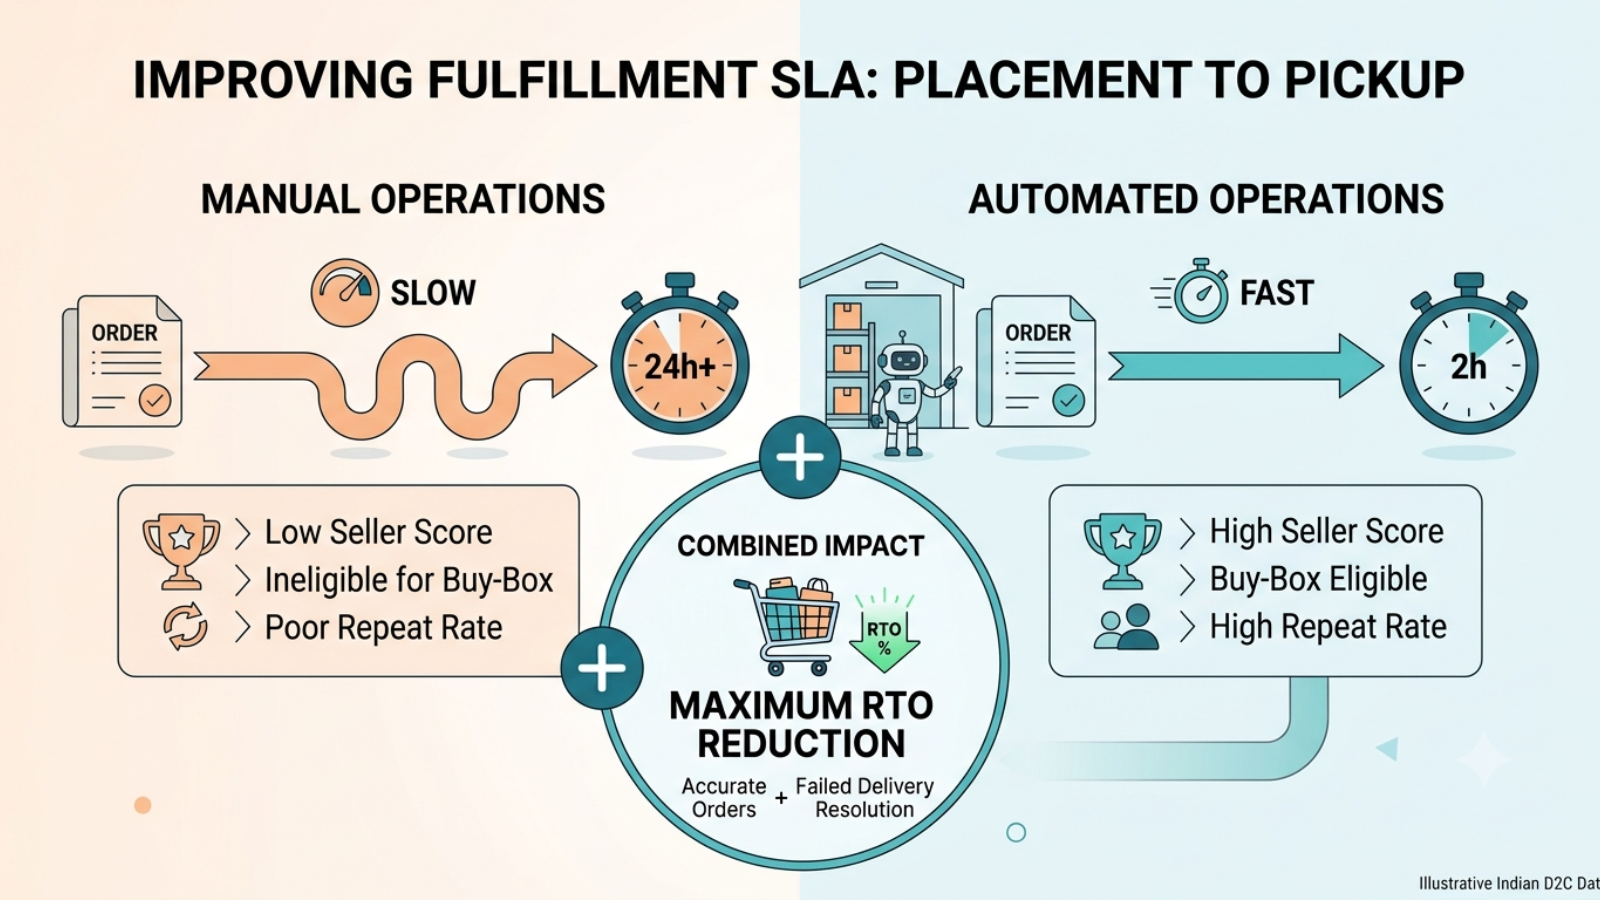 Fulfilment SLA performance, the time from order placement to courier pickup, is a primary driver of marketplace seller scores, buy-box eligibility, and customer repeat rate. D2C operations in India benchmarks show a wide spread between manual and automated ops.
Dispatch SLA Benchmarks
| Channel | SLA Requirement | Industry Average Achievement | Top Quartile Achievement |
|---|---|---|---|
| Flipkart Quick / Minutes | 4 hours | 61% within SLA | 89% within SLA |
| Amazon Prime | Next-day dispatch | 74% within SLA | 94% within SLA |
| Meesho | 48 hours | 82% within SLA | 96% within SLA |
| Myntra | 24-48 hours | 78% within SLA | 95% within SLA |
| Shopify (own website) | Brand-defined | Varies | Varies |
| ONDC network | 48 hours | 68% within SLA | 88% within SLA |
The gap between industry average and top quartile on every channel is 20-25 percentage points. That gap is almost entirely explained by automation. Brands processing orders manually cannot consistently hit 4-hour Flipkart Quick SLAs at any meaningful volume. Brands running automated OMS with pre-configured courier allocation can.
What Drives SLA Achievement
Three variables account for over 80% of SLA achievement variance in Indian ecommerce:
- Order aggregation speed: how quickly orders from all channels enter a single processing queue. Manual download cycles (every 2-4 hours) add 2-4 hours to effective processing time before fulfilment even starts.
- Courier allocation logic: manual courier selection adds 15-45 minutes per batch. Automated rule-based allocation (by pin code, weight, channel, COD/prepaid status) eliminates this.
- Pick-pack workflow: unoptimised warehouses with no bin location system, average 8-12 minutes per order. Bin-level ecommerce warehouse management in India systems reduces this to 2-4 minutes per order.
Base.com aggregates orders across 50+ channels in under 60 seconds, runs automated courier allocation, and integrates directly with warehouse scan-pack workflows, enabling brands to consistently achieve top-quartile SLA performance across every channel.
3. Order Accuracy and Warehouse Benchmarks
 Order accuracy, defined as correct item, correct quantity, correct packaging, and shipped to the correct address, is the most direct driver of returns, negative reviews, and customer service costs. Ecommerce warehouse management in India benchmarks in 2026 show the following.
Order Accuracy Benchmarks
| Fulfilment Model | Average Order Accuracy | Packing Error Rate | Wrong-Item Rate |
|---|---|---|---|
| Manual pick-and-pack (no scan verification) | 85-91% | 3-5% | 1.5-3% |
| Paper-based pick list with scan at dispatch | 91-95% | 2-3% | 0.8-1.5% |
| Bin-location WMS with scan-verify at packing | 97-99% | 0.5-1% | 0.2-0.5% |
| Fully automated fulfilment (conveyor + scan) | 99.2-99.8% | 0.1-0.3% | Under 0.1% |
The shift from manual pick-and-pack to a bin-location ecommerce warehouse management system in India delivers a 4-6x reduction in packing errors. For a brand shipping 500 orders per day, reducing packing errors from 4% to 0.5% means 17-18 fewer wrong orders daily, eliminating approximately ₹40,000-₹70,000 in daily return processing, reshipment, and customer service costs.
Base.com’s WMS module uses barcode scan-verify at the packing station. Every item scanned is cross-checked against the order manifest before the box is sealed. Mismatches trigger an immediate alert, preventing wrong-item shipments before they leave the warehouse.
Inventory Accuracy Benchmarks
| Inventory Management Approach | System-Physical Accuracy | Stockout Frequency |
|---|---|---|
| Spreadsheet-based periodic counting | 72-82% | 8-12% of SKUs monthly |
| ERP with weekly reconciliation | 84-91% | 4-7% of SKUs monthly |
| WMS with cycle counting | 94-97% | 1-2% of SKUs monthly |
| WMS with perpetual inventory + scan | 98-99.5% | Under 0.5% of SKUs monthly |
Brands running periodic manual stock counts are operating on data that is already stale when they act on it. Perpetual inventory, where every inbound, outbound, and transfer movement is scanned in real time, eliminates the reconciliation gap. This is the foundation of mature D2C operations in India.
4. NDR and Returns Benchmarks
NDR (Non-Delivery Report) management is one of the most underinvested areas in Indian ecommerce operations. The data shows significant recovery value available for brands that act within the first 24 hours of an NDR trigger.
NDR Recovery Benchmarks
| NDR Response Window | Re-delivery Success Rate |
|---|---|
| No proactive outreach (courier re-attempts only) | 28-36% |
| Brand outreach within 24 hours (call) | 42-52% |
| Brand outreach within 6 hours (WhatsApp + call) | 58-68% |
| Automated NDR workflow within 2 hours | 64-74% |
Every failed re-delivery is a guaranteed RTO. The difference between a 30% and a 65% re-delivery success rate on NDR is the difference between a 35% and a 17% overall RTO rate for COD-heavy brands.
This single intervention, automated NDR outreach within 2 hours, is the fastest way to reduce RTO in India across any category. Brands that systematically work to reduce RTO in India through NDR automation see results within 30-45 days, faster than any other operational intervention.
Base.com’s NDR workflow automatically triggers WhatsApp and SMS outreach to the buyer within 30 minutes of an NDR status update from the courier API. The message confirms delivery availability, captures address corrections, and schedules the next attempt, without any manual ops team intervention.
This is how Base.com customers reduce RTO in India rates to 22-28% in fashion categories where the industry average sits at 35-45%.
Returns Processing Benchmarks
| Returns Processing Model | Average Processing Time | Recovery Rate (Resaleable) |
|---|---|---|
| No structured returns workflow | 7-14 days | 45-60% |
| Manual grading on receipt | 3-5 days | 60-72% |
| WMS-integrated returns with disposition rules | 24-48 hours | 78-88% |
Delayed returns processing destroys inventory recovery value. A returned unit sitting unprocessed for 10 days cannot be resold during that window, and if the delay extends into a new season or promotion cycle, the unit may need to be discounted.
Automated disposition, grading returns on arrival, and routing resaleable stock directly back to live inventory, recovers 20-30% more value than manual processes.
5. Courier Performance Benchmarks India 2026
 Courier selection is one of the highest-leverage decisions in D2C operations in India. The spread in performance between the top and bottom quartile couriers on key routes is wider than most brands realise.
Top Indian Courier Performance Comparison
| Courier | First-Attempt Delivery (Metro) | First-Attempt Delivery (Tier-2/3) | Average Transit Days | COD Remittance Cycle |
|---|---|---|---|---|
| Delhivery | 82-87% | 68-75% | 2.1 days | T+2 |
| Bluedart | 88-93% | 72-78% | 1.8 days | T+3 |
| DTDC | 74-80% | 60-68% | 2.8 days | T+3 to T+5 |
| Ekart (Flipkart) | 85-90% | 70-76% | 2.2 days | T+2 |
| Xpressbees | 80-85% | 66-73% | 2.4 days | T+2 |
| Shadowfax | 79-84% | 62-70% | 2.6 days | T+1 |
| Ecom Express | 76-82% | 63-70% | 2.5 days | T+2 to T+3 |
No single courier wins across all geographies and categories. The best-performing ecommerce brands in India run multi-courier strategies, routing based on pin code performance data, COD or prepaid status, and product weight/dimensions.
Brands locked into a single courier agreement are consistently leaving 4-8 percentage points of delivery performance on the table.
Base.com’s courier allocation engine supports rule-based multi-courier routing. Brands configure priority logic, route PIN code X to Delhivery, PIN code Y to Bluedart, COD above ₹2,000 to Xpressbees, and the system executes without manual dispatch decisions.
6. Technology Adoption Benchmarks, Where Indian D2C Brands Stand
The correlation between technology adoption and operational performance is the clearest pattern in the 2026 Indian ecommerce benchmark data.
Technology Adoption vs Operational Performance
| Technology Layer | Adoption Rate (Indian D2C 2025) | RTO Impact | Order Accuracy Impact |
|---|---|---|---|
| Multi-channel OMS | 28% of brands above 500 orders/day | -6 to -9% RTO | +4-6% accuracy |
| Bin-level WMS | 19% of brands above 500 orders/day | Minimal direct | +8-12% accuracy |
| Automated NDR workflow | 22% of brands above 1,000 orders/day | -8 to -14% RTO | N/A |
| COD risk scoring (reduce RTO in India tool) | 11% of brands above 500 orders/day | -5 to -10% RTO | N/A |
| ERP integration (SAP/NetSuite) | 34% of brands above ₹50Cr revenue | Indirect | +3-5% accuracy |
| Perpetual inventory tracking | 17% of brands above 500 orders/day | -2 to -4% RTO | +10-15% accuracy |
Only 28% of Indian D2C brands processing above 500 orders per day are running a proper multi-channel OMS. The remaining 72% are still managing channel-specific workflows manually or through partial integrations.
This is the single largest operational gap in Indian ecommerce today, and the reason the benchmark spread between top and bottom performers is so wide.
The best OMS India solutions, including Base.com, have reduced the implementation barrier significantly. Modern cloud OMS platforms connect to all major Indian marketplaces and logistics providers out of the box, with ERP integration for SAP and NetSuite included. Setup time has reduced from 3-6 months to 4-8 weeks for most mid-market brands.
7. Cost Benchmarks, True Cost Per Delivered Order
 Operational cost visibility is another area where Indian D2C brands lag. Brands that cannot calculate true cost per delivered order also cannot accurately model the ROI of investments to reduce RTO in India; they underestimate the return because they are only counting forward logistics costs. Most brands know their gross shipping cost. Very few know their true cost per successfully delivered order, which includes forward logistics, failed delivery attempts, return logistics, restocking costs, and customer service costs.
True Cost Per Delivered Order, India 2026 Estimates
| Order Value Band | Forward Logistics | Failed Attempt Cost | RTO Reverse Logistics | Restocking Cost | True Cost / Delivered Order |
|---|---|---|---|---|---|
| Under ₹300 | ₹45-65 | ₹15-25 | ₹40-60 | ₹20-35 | ₹85-140 |
| ₹300-800 | ₹55-80 | ₹15-25 | ₹50-75 | ₹25-45 | ₹95-160 |
| ₹800-2,000 | ₹65-100 | ₹20-30 | ₹60-90 | ₹30-55 | ₹110-185 |
| Above ₹2,000 | ₹85-150 | ₹25-40 | ₹80-130 | ₹40-70 | ₹140-240 |
For brands in the under-₹300 order value band, the true cost per delivered order can exceed the gross margin on the product. This is the unit economics crisis that has forced dozens of Indian D2C brands to pivot away from low-AOV categories or exit them entirely.
Understanding true cost, not just shipping cost, is the baseline requirement for viable D2C operations in India at scale.
How Base.com Customers Benchmark Against These Numbers
Brands that move from fragmented tools to a unified system like Base.com don’t just see incremental improvements; they experience a structural shift in how operations perform day to day. What looks like a small change in process translates into faster order flow, fewer errors, and tighter control across channels.
Over time, this compounds. Faster processing reduces cancellations, better inventory accuracy prevents overselling, and improved NDR handling directly impacts revenue recovery.
The result is not just operational efficiency, but a measurable improvement in customer experience, marketplace rankings, and overall profitability.
- Real-time inventory sync across marketplaces eliminates overselling and reduces order cancellations.
- Automated order routing and label generation compress processing time from hours to minutes.
- Intelligent courier allocation improves delivery success rates and lowers RTO impact.
- Structured NDR workflows increase re-delivery success and recover otherwise lost revenue.
- Centralized dashboards provide SKU-level visibility, enabling faster and more accurate decision-making.
How to Use This Benchmark Data
This report is most useful as an audit tool, not just a reference document.
For each metric, compare your current performance against the industry average column first. If you are below the industry average, you have a process problem. If you are at or above average but below the top quartile, you have a technology or optimisation problem.
The three highest-impact areas to address first, based on ROI per rupee invested:
- NDR automation delivers the fastest reduction of RTO India impact, typically visible within 30 days, with no warehouse changes required. It is the single best first step to reduce RTO in India for any brand with above 200 COD orders per day.
- COD risk scoring reduces structural RTO at source, effective within 60-90 days with proper data.
- Bin-level WMS delivers the highest long-term impact on order accuracy, restocking cost, and fulfilment speed, typically realised within 60-90 days of full implementation.
Base.com supports all three on a single platform, with no separate integration required between OMS, WMS, and courier management layers.
Bottom Line
In 2026, Indian ecommerce performance is defined by benchmarks, not effort. To reduce RTO in India, top brands operate below 15% prepaid and 22% COD RTO, driven by automated NDR, COD risk scoring, and multi-courier routing. Without these, improvement plateaus.
Order accuracy above 98.5% marks top-quartile performance. Anything below 95% signals a system gap, not a training issue. A WMS with scan-verify at packing is essential to eliminate errors at scale.
SLA compliance above 88% across channels is achievable without adding headcount when the right order management software India stack handles aggregation and routing automatically.
The gap between automated, connected systems and fragmented operations is widening every quarter. Brands that consistently reduce RTO in India and hit these benchmarks follow the same path: unified platforms, automated workflows, and real-time visibility.
Frequently Asked Questions
Q1: What is the average RTO rate in India for D2C brands in 2026?
RTO runs 20-30% for prepaid and 30-40% for COD. Fashion and footwear hit 35-48% on COD. Brands using automated NDR management and COD risk scoring consistently run 10-15 points below their category average.
Q2: What is a good dispatch SLA for Flipkart and Amazon sellers in India?
Top sellers dispatch 89-94% of orders within SLA. The industry average is 61-74%. The gap comes down to order aggregation speed; brands routing orders in under 60 seconds consistently stay above 85%.
Q3: How to reduce RTO in India without turning off COD?
Layer three interventions: pin code serviceability filtering at checkout, COD risk scoring to decline high-risk orders, and automated NDR outreach within 2 hours of a failed delivery. Together, these cut COD RTO by 30-50%.
Q4: Which is the best OMS in India for selling on Amazon, Flipkart, Meesho, and Shopify together?
Look for an OMS that aggregates all channels into one processing queue, syncs inventory in real time, and connects directly to Indian courier APIs. Base.com supports all four natively, along with 50+ marketplace and logistics integrations.
Q5: What does warehouse management look like for a D2C brand processing 500-2,000 orders a day?
You need bin-level SKU location, scan-verify at packing, and real-time inventory sync to your OMS. Manual pick-and-pack at this volume produces 3-5% error rates. A cloud WMS cuts that below 1% and halves processing time.