

Every founder, operator, and investor making decisions about Indian D2C right now needs to be working from the same set of verified numbers.
The D2C ecommerce India statistics in 2026 collected here cover market size, order volumes, geographic expansion, COD dynamics, RTO rates, fulfillment costs, retention benchmarks, and operational performance, pulled from Unicommerce, Mordor Intelligence, Shipway, and verified industry reports.
No fluff. No projections dressed up as current data. Just the 50 numbers that matter most, each explained in full.
1. The India D2C ecommerce market is valued at USD 108.76 billion in 2026 and is projected to reach USD 322.1 billion by 2031, growing at a CAGR of 24.30%.
In 2020, the Indian D2C market was approximately USD 33 billion. It has more than tripled in six years, a pace that has compressed what would historically take a decade of brand building into three to four years.
At 24.30% CAGR, India’s D2C market is growing faster than China’s ecommerce market grew during its equivalent expansion phase a decade ago. For every brand currently at ₹10 crore GMV, the addressable opportunity is not a fixed target; it is expanding faster than most operational teams can keep up with.
2. The market was valued at USD 87.5 billion in 2025.
The Indian D2C market added approximately USD 21 billion in a single year, the equivalent of adding a mid-sized Southeast Asian ecommerce market in 12 months. This single-year addition exceeds the total market size of most individual European country ecommerce markets.
For brands that spent 2025 focused purely on product and marketing without investing in operations infrastructure, this growth rate means the operational gap they need to close in 2026 is materially larger than it was 12 months ago.
3. India’s D2C order volumes increased 33% year-on-year, with GMV growing 32% over the same period, based on analysis of over 400 million order items.
The near-identical SOI (share of inventory) and GMV growth rates confirm a critical insight: growth is volume-driven, not price-driven. Brands that raised prices to hit revenue targets were fighting against the market’s direction, and almost certainly lost market share to competitors who held pricing and focused on volume.
The implication for purchasing and inventory planning is significant: demand is expanding by one-third annually, which means a reorder point set in 2025 is structurally understated for 2026 demand.
4. Over 10,000 active D2C brands are selling exclusively or primarily through online channels in India as of 2026.
Ten thousand brands competing for the same consumer’s attention across the same five marketplaces means category-level competition has never been more intense. The brands that differentiate on operational reliability, faster delivery, accurate fulfillment, and lower cancellation rates are building a moat that pure marketing spend cannot replicate.
In categories like personal care and fashion, where product differentiation is limited, delivery experience and post-purchase reliability are now primary purchase decision drivers for repeat orders.
5. The number of active sellers on Flipkart and Amazon India combined is estimated to exceed 1.5 million.
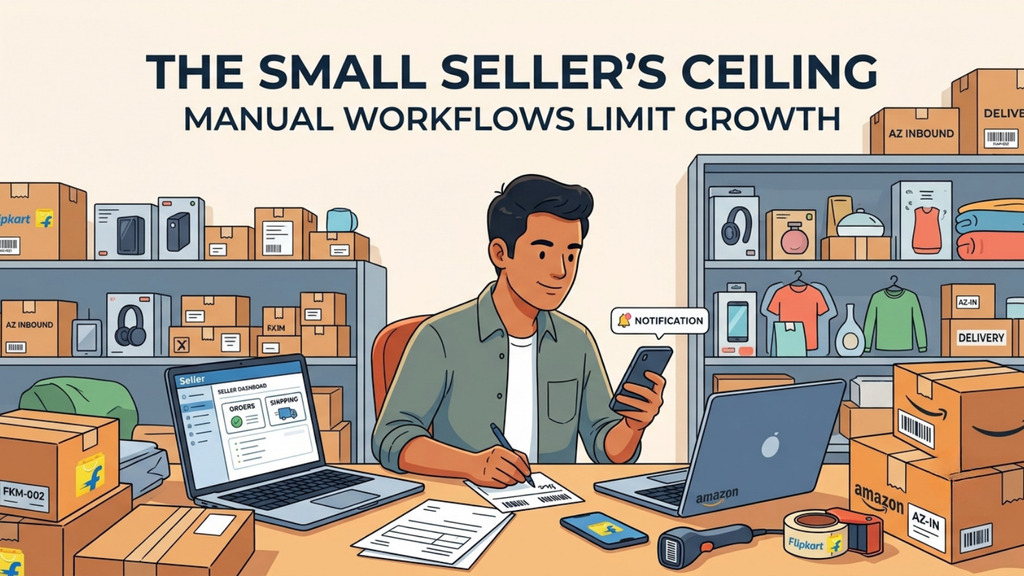
A majority of these are small and medium businesses, which means the average seller on these platforms is not a funded D2C brand with a dedicated operations team. Most are founder-operated businesses where the same person managing marketing is also managing logistics, courier disputes, and inventory reconciliation.
The operational ceiling for this seller segment is almost entirely determined by how much of their workflow is automated versus manual, and most are still manual.
6. Tier 2 and Tier 3 cities drove 66% of new D2C orders in FY26, based on data from over 6,000 digitally native brands.
Two-thirds of net new demand in Indian D2C is coming from outside the major metros, which means a fulfillment strategy optimised for Delhi, Mumbai, and Bengaluru is optimised for only 34% of future growth.
Tier 2 and Tier 3 customers have structurally higher COD preference, longer last-mile delivery timelines, and higher RTO rates, all of which require different carrier selection, different prepaid incentive strategies, and different safety stock positioning than metro-focused fulfillment models. These are the D2C ecommerce India statistics in 2026 that most fulfillment strategies are not yet built for.
7. Delhi NCR held 20.55% of the India D2C market by city cluster in 2025.
Delhi NCR is the largest single city market but represents less than a quarter of total D2C GMV, which means even the market leader by city is a minority of the total opportunity.
Brands that have built their entire fulfillment infrastructure around serving Delhi NCR optimally are well-positioned for 20% of the market and potentially under-indexed for the remaining 80%. The high disposable income and same-day delivery coverage of Delhi NCR make it the highest-conversion market per order placed, but not the highest-volume growth market going forward.
8. Hyderabad is forecast to expand at a 25.10% CAGR through 2031, making it the fastest-growing D2C city node in India.
Hyderabad’s combination of cost advantages over Mumbai, a supportive startup ecosystem, improving logistics infrastructure, and a rapidly growing tech-employed consumer base makes it the most strategically significant emerging D2C market.
For brands choosing their first regional distribution centre outside of their home city, Hyderabad’s growth trajectory means inventory positioned there today will be closer to the fastest-growing consumer base in India by 2027. Brands that wait until the market is mature to add Hyderabad fulfillment capacity will be competing for logistics space and talent at a cost premium.
9. COD still accounts for 45% of Indian D2C orders in 2026, down from 55% in 2024.
The decline from 55% to 45% in two years is meaningful; it reflects growing digital payment adoption, aggressive COD-to-prepaid conversion incentives from mature D2C brands, and UPI’s deepening penetration. However, the absolute COD volume is still rising because the overall market is growing 33% annually.
A brand that moved its COD share from 55% to 45% but also grew overall orders by 33% is actually processing more COD orders in 2026 than in 2024, just a smaller percentage of a larger total. The working capital and RTO implications of COD are not shrinking even as the percentage declines.
10. Orders from small towns now exceed 50% of GMV on platforms such as Meesho.
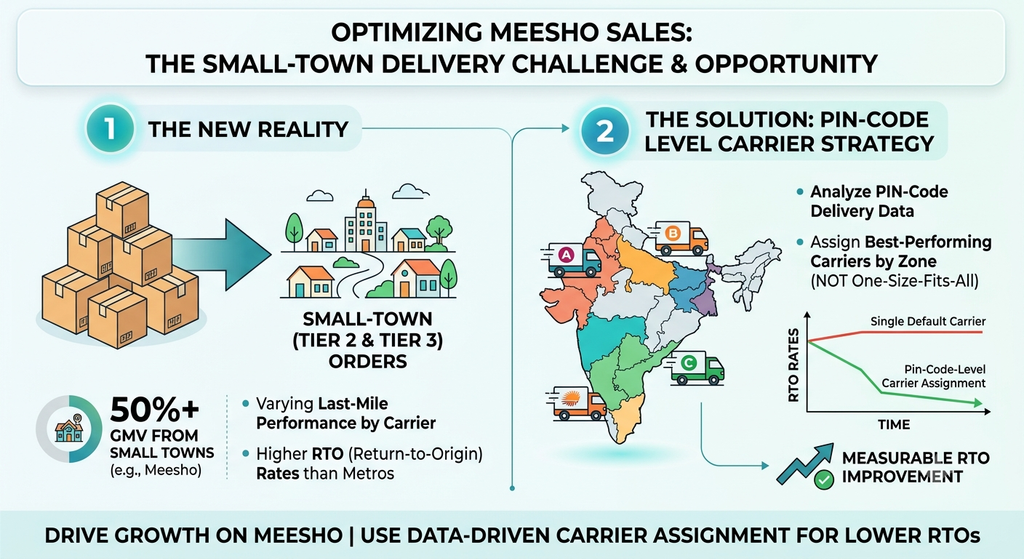
For any brand selling on Meesho, the majority of fulfillment is happening in Tier 2 and Tier 3 pin codes, where last-mile delivery performance varies significantly by carrier and where RTO rates are structurally higher than in metros.
This stat directly informs carrier selection strategy for Meesho-heavy sellers: the carrier that performs best in your metro pin codes is almost certainly not the same carrier that performs best in the small-town pin codes where most of your Meesho orders are going. Brands that use pin-code-level delivery performance data to assign carriers by zone on Meesho orders see measurable RTO improvement over brands that use a single default carrier.
11. Same-day delivery now covers 60% of Delhi NCR pin codes.
This statistic matters not just for Delhi NCR but for the entire Indian D2C delivery expectation landscape. The delivery speed baseline set by quick commerce and platform same-day delivery in metros is being imported into Tier 2 cities as the customer base expands. Consumers who receive same-day delivery from Blinkit in a Tier 2 city begin to expect faster-than-standard delivery from D2C brands as well. Brands that built operations for 4-5 day delivery timelines are now competing against a rising baseline expectation of 1-2 days across all geographies, not just in metros.
12. COD remains preferred by 70% of shoppers in small-town India.
Since Tier 2 and Tier 3 cities drove 66% of new orders in FY26, and 70% of those customers prefer COD, the growth of Indian D2C is structurally linked to COD management capability. A brand that cannot manage COD efficiently cannot profitably serve the majority of its growth market. Robust returns management, pre-dispatch verification, and smart courier selection are not operational niceties for this customer segment; they are the difference between a profitable Tier 2/3 expansion and a cash-burning one.
13. These COD dynamics are among the most impactful D2C ecommerce India statistics in 2026 for unit economics.
A brand doing ₹2 crore a month in COD on a 10-day remittance cycle carries about ₹66 lakh in float, versus roughly ₹13 lakh on a 48-hour cycle.
The ₹53 lakh difference between a 10-day and a 48-hour remittance cycle is working capital that is physically available but financially inaccessible; it cannot fund inventory purchases, ad spend, or operational expenses until the courier remits it.
For bootstrapped D2C brands operating without external capital, this float is often the difference between being able to fund the next inventory purchase on time and having to delay it. Choosing a courier or aggregator with faster COD remittance is not a logistics optimisation; it is a working capital decision.
14. For most Indian D2C brands, COD contribution margin is 40-60% lower than prepaid CM2 due to higher RTO rates and remittance fees.
This stat quantifies the true cost of COD beyond the obvious remittance delay. A COD order that completes successfully still costs more per order than a prepaid order, because COD handling fees, higher RTO rates, and longer remittance cycles collectively compress the contribution margin to 40-60% of what the same order would generate on prepaid.
The implication: even modest COD-to-prepaid conversion improvement at checkout has a disproportionately large impact on overall brand profitability, because the margin profile of every converted order is fundamentally different.
15. Brands like Snitch moved from 50% COD to under 20% COD through aggressive prepaid incentives of ₹50-100 discount at checkout.
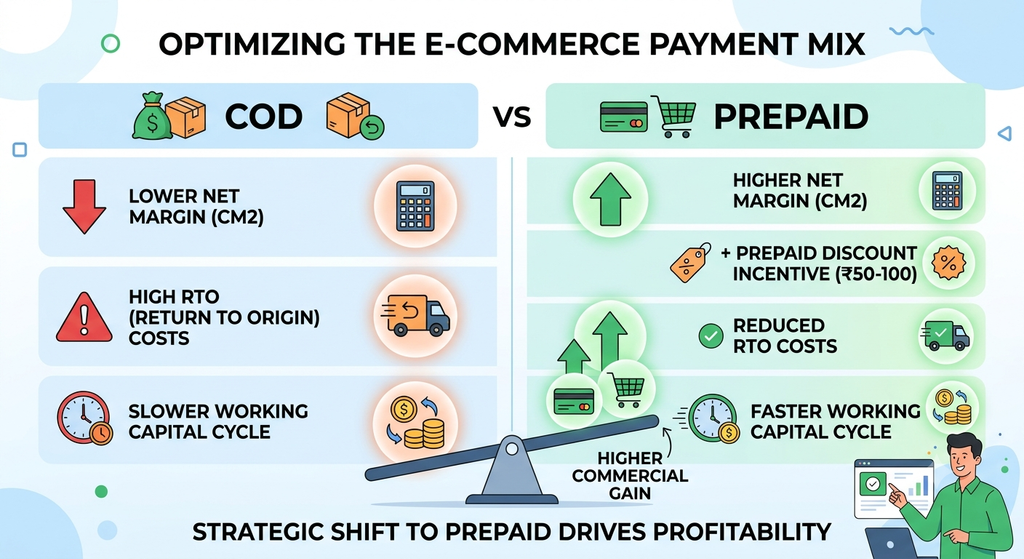
The ₹50-100 discount offered to convert a COD order to prepaid appears to reduce order value at checkout. In practice, it is commercially positive in almost every scenario, because the improved CM2 on the prepaid order, the avoided RTO cost on the COD order, and the faster working capital cycle of a prepaid payment together create a net gain that far exceeds the discount amount. Snitch’s move from 50% to under 20% COD is the most concrete publicly available case study of systematic prepaid conversion in Indian D2C.
16. Meta ad CAC rose 32% year-on-year, from ₹380 average in 2025 to ₹502 in 2026.
A ₹502 CAC on a COD order that generates an RTO means the brand spent ₹502 to acquire a customer, paid forward shipping, paid reverse shipping, and collected zero revenue. The cumulative cost of a single COD RTO in 2026, CAC plus forward logistics plus reverse logistics, often exceeds the full order value.
Brands that have not recalculated their CAC payback assumptions in light of the 32% YoY increase are making media spend and channel expansion decisions on outdated unit economics.
17. Customer acquisition costs for D2C brands surged 22-35% over the past two years, driven by increased competition, ad fatigue, and tightening data privacy norms.
The two-year compounding of CAC increases means a brand that has not improved retention metrics since 2024 is now running a structurally more expensive acquisition model for the same revenue output.
A 30% CAC increase with flat retention means the brand needs 30% more ad spend to acquire the same number of new customers, which, at constant margins, means 30% more working capital consumed in customer acquisition without a proportional increase in long-term revenue. Retention improvement is the only lever that breaks this compounding cycle.
18. The national average RTO rate is one of the most cited D2C ecommerce India statistics in 2026, and one of the least acted upon.
The national average RTO rate for D2C brands in India sits between 20-30%, reaching 40% in fashion and footwear categories.
For every 10 orders shipped in the fashion category, 4 come back. Each returned order pays double shipping, forward and reverse, and collects zero revenue on COD orders.
A fashion brand at a 40% RTO rate is not a brand with a demand problem or a product problem. It is a brand with an operations problem, specifically, pre-dispatch verification, courier allocation, and COD management, that is solvable with the right tooling and process.
19. RTO rates reached nearly 39% during the November 2025 festive season before dropping to approximately 21% by February 2026.
The 18-percentage-point gap between peak festive RTO and post-festive RTO is not explained by different customers or different products, the same brands, the same SKUs, the same marketplaces.
The gap is explained entirely by three operational decisions that the brands at 21% made and the brands at 39% did not: prepaid incentives at checkout, pin-code-level courier routing based on delivery performance, and address verification before dispatch.
These are not technology investments that take months to implement. They are process changes that can be activated in days.
20. COD returns ran at 58% during the festive quarter.

More than half of all COD orders placed during the festive season in 2025 resulted in a return. This stat should permanently reframe how brands think about COD-heavy festive season campaigns.
A brand that runs aggressive festive season discounts to drive COD order volume is, statistically, shipping more than half of those orders to warehouses it started from, at the cost of double shipping per failed order.
The festive season playbook for COD-heavy brands must include pre-dispatch verification, carrier optimisation, and prepaid conversion incentives as non-negotiable elements, not post-campaign considerations.
21. Less than 2% of prepaid orders are returned, while nearly 26% of non-prepaid orders are returned.
The 24-percentage-point RTO rate differential between prepaid and COD orders on the same platform, for the same brand, selling the same products, is the single most compelling data point for prioritising COD-to-prepaid conversion as an operational initiative.
The customer who paid upfront is invested in receiving the product. The customer who did not pay upfront is not. This is not a product quality issue, a delivery speed issue, or a pricing issue; it is a payment commitment issue, and it is structurally solvable at the checkout and pre-dispatch stages.
22. Every year, Indian D2C brands collectively lose over ₹8,000 crore to Return to Origin.
₹8,000 crore is not lost demand; it is converted demand that cleared checkout, entered the fulfillment system, was picked, packed, labeled, and dispatched, and was then lost in the last mile. Every rupee of that ₹8,000 crore represents a customer who was willing to buy but was not captured. The majority of it is operationally preventable through pre-dispatch verification, carrier selection, and prepaid conversion, which means the D2C ecommerce India statistics in 2026 on RTO represent a recoverable opportunity, not an unavoidable structural cost.
23. A single RTO on a ₹1,200 order costs your business anywhere from ₹350 to ₹700, once you include forward and reverse logistics, repackaging, and the cost of capital.
The ₹350-700 loss figure does not include the revenue that was not collected on a COD order. On a fully loaded basis, ₹350-700 in logistics and operational cost plus ₹1,200 in unrealised revenue, the true cost of a single COD RTO on a ₹1,200 order is ₹1,550-₹1,900. Most brands account for the logistics cost in their P&L.
Almost no accounts for the unrealised revenue. Recalculating RTO cost on a fully loaded basis, including the order value that was never collected, consistently produces a number that makes RTO reduction the highest-ROI initiative in the business.
24. At a 30% RTO rate on 1,000 monthly COD orders, that is 300 RTOs costing ₹1,05,000 to ₹2,10,000 every single month.
Over a year, that is ₹12.6-25.2 lakh bleeding from one operational failure mode, enough to fund an entire performance marketing channel, hire a senior operations head, or fund the next product launch. Most brands know their RTO rate.
Very few have done this monthly cost calculation and held it next to their marketing budget to compare. The brands that do this calculation almost always reprioritise operational investment over incremental ad spend.
25. Every 1% reduction in RTO rate directly improves CM2 by ₹15-25 per order for most Indian D2C brands.
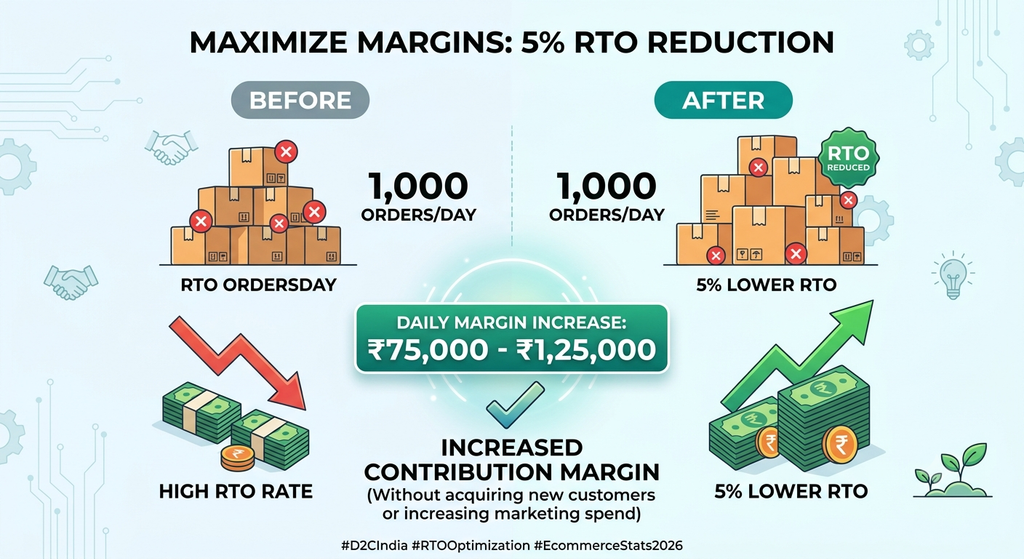
For a brand doing 1,000 orders per day, a 5% RTO reduction generates ₹75,000-₹1,25,000 in additional daily contribution margin, without acquiring a single additional customer, launching a single new product, or increasing any marketing spend.
This is the purest form of margin improvement available in Indian D2C: extracting more value from demand that already exists by reducing the operational failure rate on orders already placed. No other single initiative in the D2C ecommerce India statistics in 2026 offers this ratio of effort to margin impact.
26. Address verification via WhatsApp or SMS alone cuts RTO by 15-20%.
This is the highest-ROI single intervention available to COD-heavy brands because it requires no technology overhaul, no courier renegotiation, and no checkout redesign.
Sending a WhatsApp message to a customer after a COD order is placed, asking them to confirm the address before dispatch, filters out orders placed with incorrect addresses, orders placed with no genuine intent to receive, and orders placed with phone numbers that are no longer active.
Each of these categories is a preventable RTO that the verification step catches before the shipment is created.
27. IVR verification typically reduces RTO by 20-30% on its own, making it the highest-impact single intervention available to COD-heavy brands.
An automated call placed within seconds of a COD order being placed creates a psychological commitment that a passive order confirmation does not. Customers who answer and confirm their order are significantly more likely to accept delivery.
Customers who do not answer or who cancel on the call reveal their low purchase intent before the brand has spent a rupee on fulfillment.
At scale, IVR verification is one of the few interventions where the cost per prevented RTO is a fraction of the cost per RTO it avoids.
28. The fulfillment cost D2C ecommerce India statistics in 2026 reveal why shipping is a margin lever, not just a cost line.
For many Indian D2C brands, shipping can consume 20 to 30 percent of order value, especially for low-ticket items.
For a ₹499 fashion brand, a ₹100-150 shipping cost is a 20-30% gross margin reduction before a single other cost is accounted for. At this level, the shipping cost line is not a fulfillment overhead; it is the primary determinant of whether the business model is viable at that price point.
Brands selling low-ticket items that have not negotiated per-order shipping rates as a commercial priority are almost certainly not generating positive contribution margin on their COD orders.
29. Delayed delivery drives 41% of customer churn in Indian eCommerce, making carrier selection a direct revenue retention lever.
A customer who receives a delayed delivery is not just an unhappy customer for that order; they are a retention loss. 41% of churned customers identified delivery delay as the primary reason they stopped buying from a brand.
Since customer acquisition costs ₹502 on average and retention is 5-7x more cost-effective, a carrier selection decision that increases delivery delay rate by 5% is creating a retention loss that is worth significantly more than any per-shipment rate saving that motivated the carrier choice.
30. Unified GST has lowered interstate transit dwell time and logistics costs by 20-25%, enabling more efficient national fulfillment models.

Pre-GST, interstate shipments in India were delayed at state borders for checkpost clearance, adding 12-24 hours to interstate delivery timelines and creating warehousing requirements in each state to avoid interstate transit delays.
Post-GST, brands can fulfill from centralised or strategically positioned warehouses without the state-border delay penalty. This structural improvement is available to every brand, but only those who have transitioned from state-by-state warehousing to a centralised multi-warehouse model can fully capture the cost savings.
31. Delhivery acquired Ecom Express in 2025, creating a consolidated network now covering 18,800+ pin codes with AI-powered address correction.
This is the most consequential logistics consolidation event in Indian ecommerce in the past three years. The acquisition eliminated Ecom Express as an independent competitor and made Delhivery the dominant volume player in Indian ecommerce logistics by a significant margin.
Brands that were previously splitting volume between Delhivery and Ecom Express for competitive rate leverage have lost one of their primary negotiating counterweights, which makes courier aggregator relationships and multi-carrier allocation through OMS platforms more commercially important, not less.
32. Bluedart maintains the lowest RTO rate in the market at roughly 8-10%, compared to Delhivery’s 10-12% and DTDC’s 15%.
The 2% RTO rate advantage Bluedart holds over Delhivery sounds small in isolation.
On a ₹5,000 electronics order with 1.5x shipping loss per RTO, that 2% difference translates to ₹150 per 100 orders in avoided RTO costs, which typically exceeds the ₹50-80 premium Bluedart charges per shipment over Delhivery.
The math for using Bluedart on high-value shipments is almost always positive when calculated on a per-RTO-cost basis rather than a per-shipment-rate basis.
33. Xpressbees offers a COD-to-prepaid conversion feature that allows customers to convert COD orders to prepaid via a payment link before delivery.
This feature is unique among Indian couriers at scale. A customer who placed a COD order and has not yet committed their payment is a high RTO risk; the Xpressbees payment link converts that risk at the last possible moment before dispatch.
Brands using Xpressbees for COD-heavy orders effectively get a pre-dispatch prepaid conversion opportunity built into their courier workflow at no additional setup cost. For fashion and general merchandise brands where COD RTO rates run at 25-40%, this feature alone can justify carrier selection.
34. Shadowfax launched Shadowfax 360 in April 2026, covering 15,000+ pin codes with a flat-rate billing model and an AI-powered RTO predictor.
The flat-rate billing model eliminates weight-based billing disputes, one of the most common and time-consuming sources of courier reconciliation overhead for D2C brands. Weight dispute resolution with carriers typically consumes 3-5 hours of operations team time per week for brands doing 500+ daily orders.
At a loaded hourly cost of ₹500 per team hour, that is ₹7,500-₹12,500 per month in operations overhead that Shadowfax 360’s flat-rate model eliminates structurally. The AI-powered RTO predictor adds a pre-dispatch risk scoring layer on top of the pricing simplification.
35. Ekart went live on the ONDC Network in June 2025, enabling logistics interoperability where providers can be selected dynamically per order.
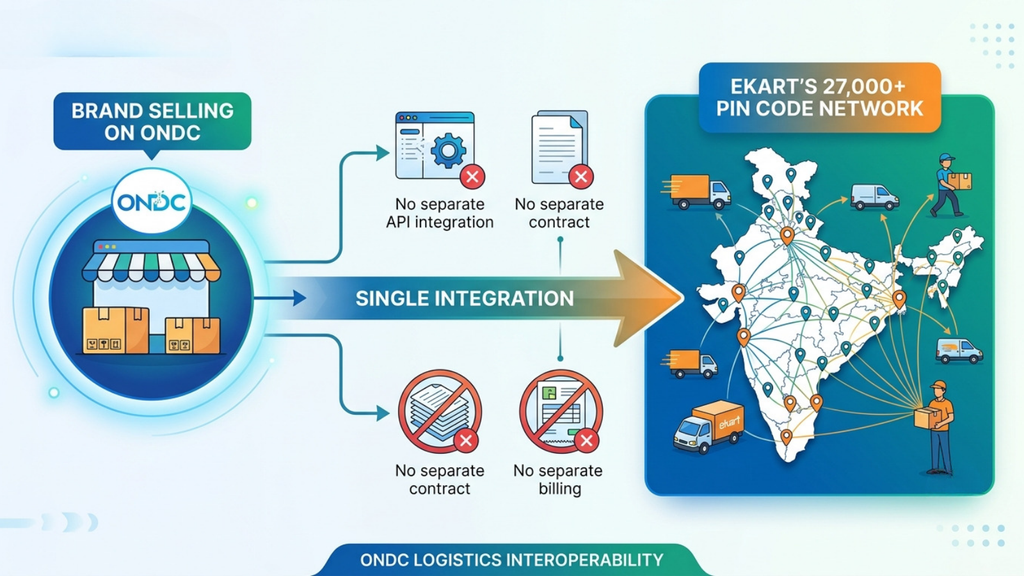
ONDC’s logistics interoperability model means that a brand selling on ONDC can now access Ekart’s 27,000+ pin code network without a separate API integration, a separate contract, or a separate billing relationship.
For brands that have avoided building on ONDC because of the logistics integration complexity, Ekart’s ONDC-native availability removes that barrier. As ONDC transaction volume grows, it reached a meaningful scale in 2025, and the ability to fulfill ONDC orders through Ekart without additional integration overhead becomes a meaningful distribution expansion option.
36. Many Indian D2C brands operate at just 2 to 3 inventory turns per year, meaning inventory sits for 120 to 180 days.
120 to 180 days of inventory sitting in a warehouse is 120 to 180 days of working capital that cannot fund advertising, product development, or operational improvements. A brand at 3 inventory turns with ₹1 crore of average inventory has ₹1 crore locked in stock at any given time.
Moving to 6 turns effectively frees ₹50 lakh of that working capital into active deployment, without raising a rupee of external funding. The D2C ecommerce India statistics in 2026 on inventory turns are the ones most directly connected to the capital efficiency gap between funded and bootstrapped brands.
37. A D2C fashion brand at 3 inventory turns per year with 25% RTO in Tier 2 cities typically ends up running 20% discounts to clear ageing SKUs.
The discount is the visible symptom that appears on the P&L. The inventory turns figure is the underlying cause that never appears as a line item. A 20% markdown to clear stock that has been sitting for 120+ days is not a promotional strategy; it is a capital recovery operation.
Brands that improve inventory turns to 6-8 through velocity-based purchasing, and ABC-tier reorder logic eliminate the need for clearance discounting entirely, because stock does not age long enough to require it.
38. At 6 to 8 inventory turns per year, inventory moves every 45 to 60 days, dead stock stays under 10%, and cash cycles stabilise.
The cash cycle stabilisation at 6-8 turns is the compounding benefit that the headline metric understates. When cash cycles are stable, brands can predict working capital requirements accurately enough to plan inventory purchases, ad spend, and operational investments with confidence.
Brands at 2-3 turns have unpredictable cash cycles because they cannot accurately forecast when inventory will convert to cash, which forces conservative purchasing decisions that then create stockouts on fast-moving SKUs.
39. Excess inventory increases holding costs, forces deeper discounts, and leads to write-offs, affecting both margins and inventory cash flow simultaneously.
The triple damage of excess inventory, holding cost, forced discount, and write-off risk is why overbuying is more dangerous than understocking for most Indian D2C brands at the ₹5-20 crore GMV range. A stockout loses a sale.
Overstock loses the sale and locks the capital, adds a storage cost, and may still result in a markdown or write-off. The asymmetry of these outcomes makes velocity-based purchasing, buying what you can sell in 45-60 days, not what you might sell in 180, the operationally correct default position for most D2C categories.
40. If restock delays for returns exceed 3 to 5 days, available inventory appears lower than actual, triggering unnecessary reordering.
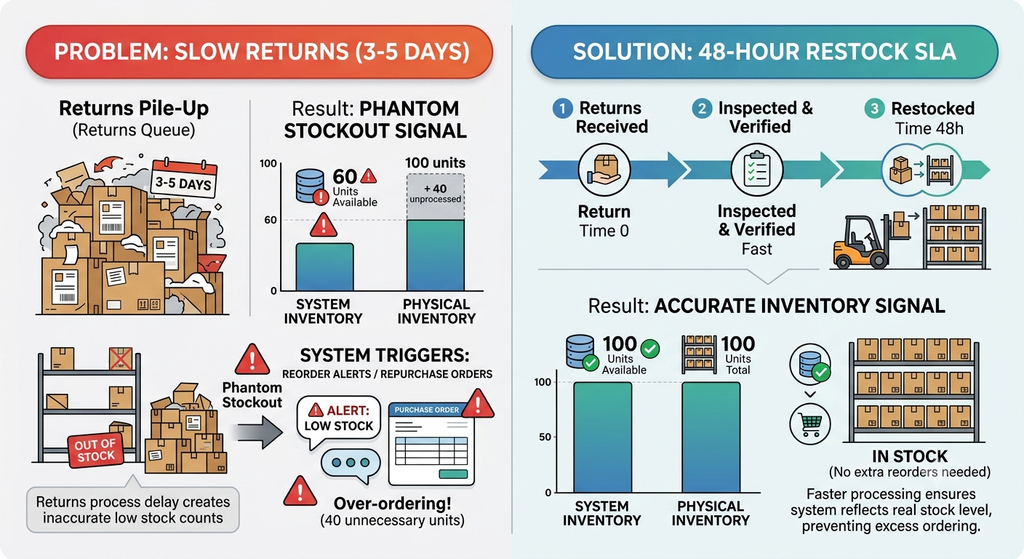
Returns sitting unprocessed in the warehouse for 3-5 days before being inspected and restocked create a phantom stockout signal; the system shows lower available inventory than physically exists, which triggers reorder alerts and sometimes purchase orders for stock that is already in the building waiting to be processed.
Brands with high return rates (20-30%) and slow returns processing are systematically over-ordering because their inventory system does not reflect the units sitting in the returns queue. A 48-hour returns restock SLA is the operational standard that eliminates this reorder distortion.
41. India’s ecommerce return rate is 15-35% by category, with fashion and ethnic wear running at 25-35%.
Fashion’s 25-35% return rate is not simply a product fit issue; it reflects a category where customers routinely order multiple sizes or variants to try at home, with the intention of returning all but one.
This behaviour is structurally built into how Indian fashion consumers shop online, which means fashion D2C brands cannot treat returns as exceptions to be minimised.
They must treat returns as a core operational workflow to be automated, with structured intake, rapid QC, and same-session restocking, because at 25-35% return rates, the returns process is handling one-quarter to one-third of the total order volume every single day.
42. India’s reverse logistics market is projected to reach $39.81 billion by 2027 at a 6.15% CAGR.
A $39.81 billion reverse logistics market is not a problem to be managed; it is an infrastructure category in its own right. The growth of this market reflects the scale of the returns challenge across Indian ecommerce, but it also reflects the increasing professionalisation of returns handling as a distinct operational competency.
Brands that treat returns as a cost centre rather than an operational function with its own metrics, SLAs, and technology stack are ceding margin to the brands that have systematised it.
43. The average repeat purchase rate for most Indian D2C brands hovers around 28-35%.
A 28-35% repeat purchase rate means 65-72% of customers who bought from a brand never came back. For a brand spending ₹502 per new customer acquisition, 65-72% of that spend generated a customer who delivered a single transaction and then went to a competitor.
The D2C ecommerce India statistics in 2026 on retention are not abstract; they translate directly into how much of a brand’s total marketing spend is generating long-term revenue versus single-transaction revenue.
44. Brands with a 25%+ repeat purchase rate have 3.4x higher profit margins than brands with under 15% repeat rate.
The 3.4x profit margin multiplier from a 10-percentage-point repeat rate improvement is the most commercially significant ratio in all of D2C ecommerce India statistics in 2026. It is not a 3.4x improvement in revenue; it is a 3.4x improvement in profit margin, which compounds differently.
A repeat customer has near-zero CAC, higher average order values over time, higher conversion rates from retention channels versus paid channels, and a significantly lower RTO rate because they are a verified buyer with genuine purchase intent.
45. Retention marketing is 5-7x more cost-effective than acquisition marketing.
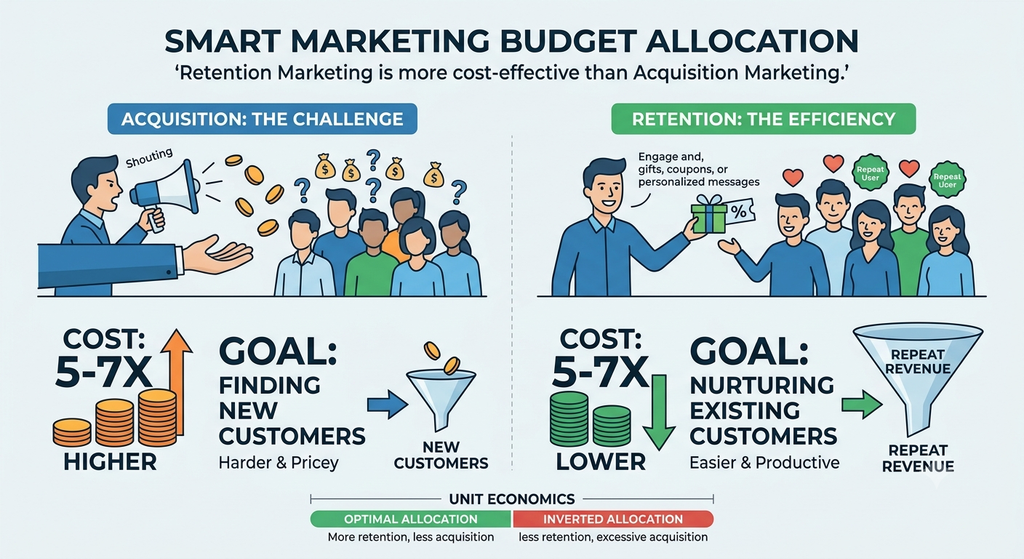
This ratio does not mean retention is always more valuable than acquisition; new customer growth is still required for scale. It means that the marginal rupee of marketing spend is almost always more productive when allocated to retaining existing customers than to acquiring new ones, up to the point where the retained customer base is large enough to generate the repeat revenue target.
Brands that allocate 90% of their marketing budget to paid acquisition and 10% to retention are operating with an inverted ratio relative to their true unit economics.
46. A 5% improvement in retention can reduce effective CAC by 15-25% because fewer new customers are needed to hit the same revenue target.
This is the compounding mechanic that makes retention the highest-leverage investment in Indian D2C in 2026. If existing customers generate more repeat revenue, the brand needs fewer new customers to hit its GMV target, which means less ad spend per rupee of revenue, which means lower effective CAC across the entire business, not just for retention-sourced orders.
A 5% retention improvement does not deliver 5% less ad spend. It delivers 15-25% less required ad spend at the same revenue level.
47. Quick commerce grew 85% year-on-year for FMCG D2C brands. Blinkit, Zepto, and Swiggy Instamart are now meaningful revenue channels.
85% YoY growth makes quick commerce the fastest-growing distribution channel in Indian D2C by a significant margin.
For FMCG, personal care, and health supplement brands, quick commerce is no longer an experimental channel; it is a primary revenue line that requires dedicated inventory allocation, dark store positioning, and rapid replenishment logistics. Brands that have not activated Blinkit, Zepto, or Instamart by late 2026 are ceding the fastest-growing demand channel to competitors who have.
48. Top-performing D2C brands achieve 40-50% lower CAC through better creative, stronger organic presence, and higher conversion rates.
The gap between average and top-performing brands on CAC is 40-50%, not 5-10%. This is not a marginal efficiency difference. It reflects structural advantages that compound over time: better conversion rates that convert more efficiently, organic presence that reduces paid dependency, and higher site conversion rates that produce more orders from the same traffic.
Brands that close this CAC gap do not primarily do it through better media buying; they do it through better product-market fit, better post-purchase experience, and better retention that reduces the reliance on paid acquisition for revenue targets.
49. Brands with a strong omnichannel strategy retain 89% of their customers, compared to only 33% for those with a single-channel approach.
The 56-percentage-point retention gap between omnichannel and single-channel brands is the most dramatic retention statistic in D2C ecommerce India statistics in 2026. A brand that engages its customers across its D2C website, Amazon, WhatsApp, email, and offline retail is creating seven times more retention touchpoints than a brand that only sells on one channel.
Each additional channel is not just a new revenue source; it is a retention mechanism that reduces the probability of a customer going to a competitor the next time they are in the market for the product category.
50. The India D2C ecommerce market will reach USD 322.1 billion by 2031. The brands that will capture a disproportionate share of that USD 322.1 billion are not the ones with the best products or the most aggressive marketing budgets today.
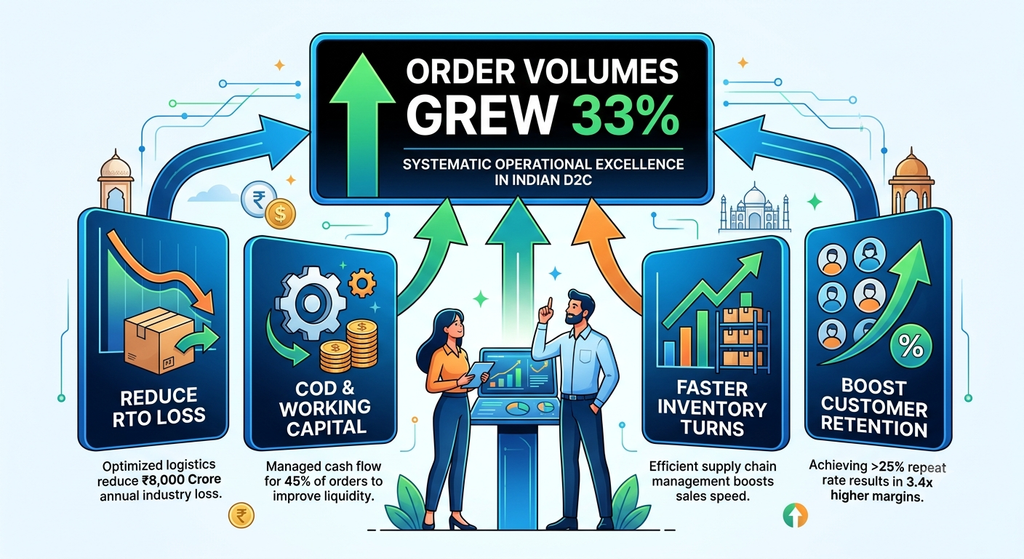
They are the ones who read the D2C ecommerce India statistics in 2026 on RTO, COD working capital, inventory turns, and retention, and built their operations to improve each metric systematically. Order volumes grew 33%. ₹8,000 crore is lost to RTO annually. COD runs at 45% of orders. 3.4x higher margins separate brands above and below 25% repeat rate. The market rewards execution. These numbers define exactly what execution means in Indian D2C in 2026.
What These D2C Ecommerce India Statistics in 2026 Mean for Your Operations
The 50 statistics above tell a single coherent story when read together.
Demand is growing at 33% annually, driven by Tier 2 and Tier 3 cities that account for 66% of new orders. Those customers prefer COD at 70%. COD RTO rates touched 58% during the festive season. Shipping consumes 20-30% of the order value on low-ticket items. Inventory sits for 120-180 days at typical turn rates. ₹8,000 crore in revenue is lost to RTO annually.
Every one of these D2C ecommerce India statistics in 2026 represents a recoverable margin gap, not an unavoidable structural cost. The brands at 21% RTO were in the same market as the brands at 39% RTO. The brands with 6-8 inventory turns were operating in the same supply chain environment as brands with 2-3 turns. Brands with 25%+ repeat rates have 3.4x higher margins, and they were selling to the same customers in the same market.
The difference was operational decisions, not market conditions. The D2C ecommerce India statistics in 2026 exist to make those decisions unavoidable.
How Base.com Addresses the Operational Gaps These Statistics Reveal
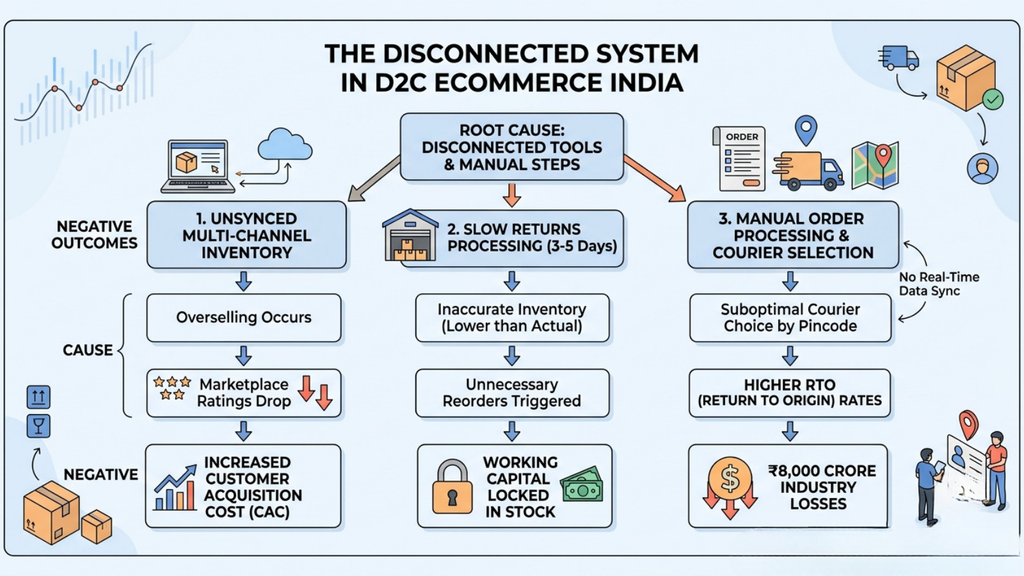
The D2C ecommerce India statistics in 2026 on RTO, fulfillment cost, and inventory accuracy all point to the same root cause: operations managed through disconnected tools, manual steps, and separate systems that do not share data in real time.
Multi-channel inventory is not synced in real time → oversells occur → marketplace ratings drop → organic ranking falls → CAC increases to compensate.
Returns sit unprocessed for 3-5 days → available inventory appears lower than actual → unnecessary reorders are triggered → working capital is locked in stock that should have been resold.
Orders are manually processed → courier selection is not optimised by pin code delivery performance → RTO rates stay above the preventable baseline → ₹8,000 crore in industry-wide losses persists.
Base.com addresses all three failure modes from one platform. The Order Manager consolidates all channels into one inventory pool with real-time sync. The WMS manages pick, pack, and returns with barcode validation at every stage. Workflow Automation routes each order to the optimal courier based on configured rules, pin code, order value, and COD flag, without manual selection per order. Base Analytics surfaces channel-level sell-through data so purchasing decisions reflect actual velocity, not assumptions.
The D2C ecommerce India statistics in 2026 show what is going wrong across the market. Base.com’s architecture addresses the operational root cause of each failure category, not as separate features, but as one connected system where every module shares the same data layer.


[…] still accounts for approximately 45% of Indian D2C orders, down from higher levels a few years ago, but still the dominant payment method across Tier 2 and […]