


To forecast product demand before an ecommerce sale, establish a clean 60-day baseline per SKU per channel, apply a promotional lift factor derived from your own past sale cycles, adjust for the commercial window rather than the official sale dates, and express the output as a range with three scenarios rather than a single number.
A point forecast for a promotional period is a guess wearing a decimal point.
Why How to Forecast Product Demand Before an Ecommerce Sale Differs From Normal Forecasting
Business-as-usual forecasting predicts continuation. Sale forecasting predicts disruption. The methods that work for one actively mislead in the other.
Industry benchmark data illustrates the gap clearly: FMCG and staple categories typically run MAPE of 10-25% on high-velocity SKUs, but promotions push that to 25-35% during event periods. Error roughly doubles when a promotion is applied to the same SKU you were forecasting accurately last month.
Fashion and apparel sit worse still, with MAPE commonly reported at 35-60% given short lifecycles and trend-driven demand.
Indian festive events compound this.
Four structural differences change the method:
- The signal you are extrapolating is not in your history. Unless you ran the same discount on the same SKU with the same placement last year, your baseline data does not contain the event you are forecasting.
- Demand concentrates rather than distributes. A six-day window can carry a month of volume, so the error compresses into a period where you cannot correct it.
- The forecast drives an irreversible decision. Stock committed to a marketplace fulfilment centre cannot be recalled mid-sale.
- Discount depth is an input you control. This is the one advantage. Unlike weather or trend, you set the variable that drives most of the lift.
Anyone working out how to forecast product demand before an ecommerce sale should start by accepting that the goal is not a precise number. It is a defensible range with known error bounds.
What Forecast Accuracy Should You Actually Expect?
Setting a realistic accuracy target matters, because teams that expect precision either over-invest in modelling or quietly adjust the forecast to match a revenue target.
|
Context |
Typical MAPE |
Interpretation |
|---|---|---|
|
Ecommerce overall |
15-40% |
60-85% accuracy; mature AI-driven programmes reach 80-90% |
|
FMCG / staples, high-velocity SKUs |
10-25% |
Best-case conditions |
|
Same SKUs during promotional events |
25-35% |
Error roughly doubles under promotion |
|
Fashion and apparel at SKU level |
35-60% |
Short lifecycle, trend-driven |
|
New product, first two quarters |
40-60% |
Normal, not a failure |
|
Mature hero SKU, three years stable history |
Below 20% |
Achievable ceiling |
Two further points from the same body of benchmark research are worth internalising.
Each additional month of forecast horizon commonly adds 2-5 percentage points of weighted error. Forecasting a sale twelve weeks out is meaningfully harder than forecasting it four weeks out, which is an argument for staged commitment rather than one large early buy.
Gartner data indicates 58% of retail and DTC brands run inventory accuracy below 80%. If your underlying stock records are wrong, forecast sophistication cannot rescue the plan.
Verify these ranges against your own measured history before adopting them as targets. They are aggregated from multiple industry publications rather than a single audited study. Set the accuracy expectation before you start, because a team that believes how to forecast product demand before an ecommerce sale should produce a precise number will manufacture false precision to deliver one.
The Five Data Sources to Feed the Forecast
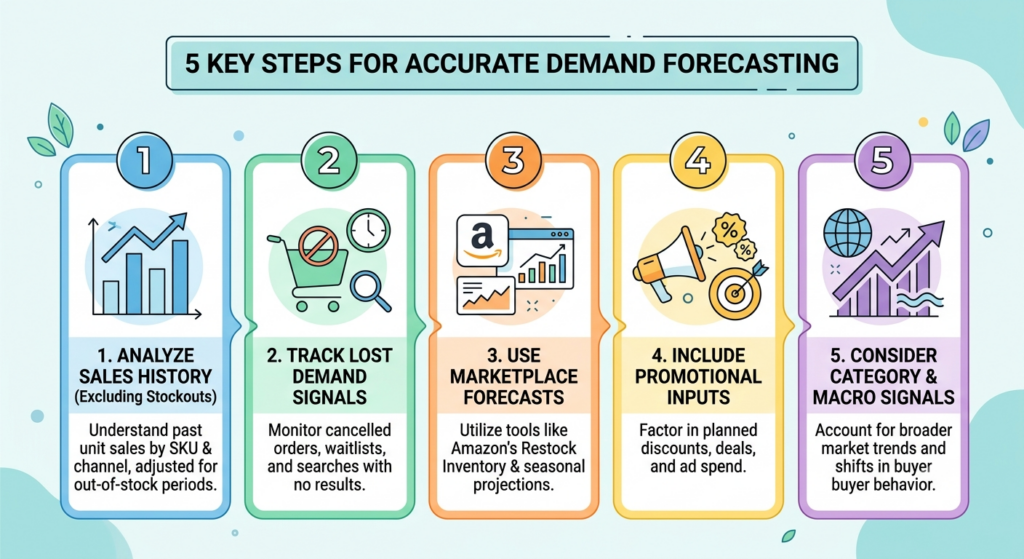
Most Indian sellers forecast from one source: last year’s sales. That is the weakest available input, because it records what you were able to supply rather than what customers wanted.
1. Your own unit sales history, by SKU and by channel. The foundation, but only after excluding stockout periods. A SKU that sold 200 units while out of stock for four days did not have demand of 200.
2. Lost-demand signals. Cancelled orders, out-of-stock listing views, waitlist sign-ups, and search-with-no-result events. This is the correction that stops last year’s stockout from becoming this year’s under-buy.
3. Marketplace native forecasts. Amazon’s Restock Inventory tool calculates days of supply and recommends reorder quantities from your sales velocity, and its seasonal demand forecast projects weekly demand from past seasonal patterns. It is free, it is already in your account, and it reflects Amazon’s own view of your demand.
4. Committed promotional inputs. Discount depth, deal slots, banner placements, and ad budget. These are the largest controllable drivers of lift, and they belong in the forecast as explicit variables rather than as vague optimism.
5. Category and macro signals. Redseer identified a dual-peak pattern in 2025, with GST slab simplification pushing high-ticket purchases past Diwali into a second wave. Category-level shifts of that kind will not appear in your own SKU history at all.
Any credible method for how to forecast product demand before an ecommerce sale uses at least the first four. Relying on history alone is what produces the same error every year.
Step by Step: How to Forecast Product Demand Before an Ecommerce Sale
This is the detailed working method. Run it per SKU per channel. Steps 1 to 4 build the number, steps 5 to 8 stress it, steps 9 and 10 convert it into a decision.
Step 1: Clean the History Before You Touch It
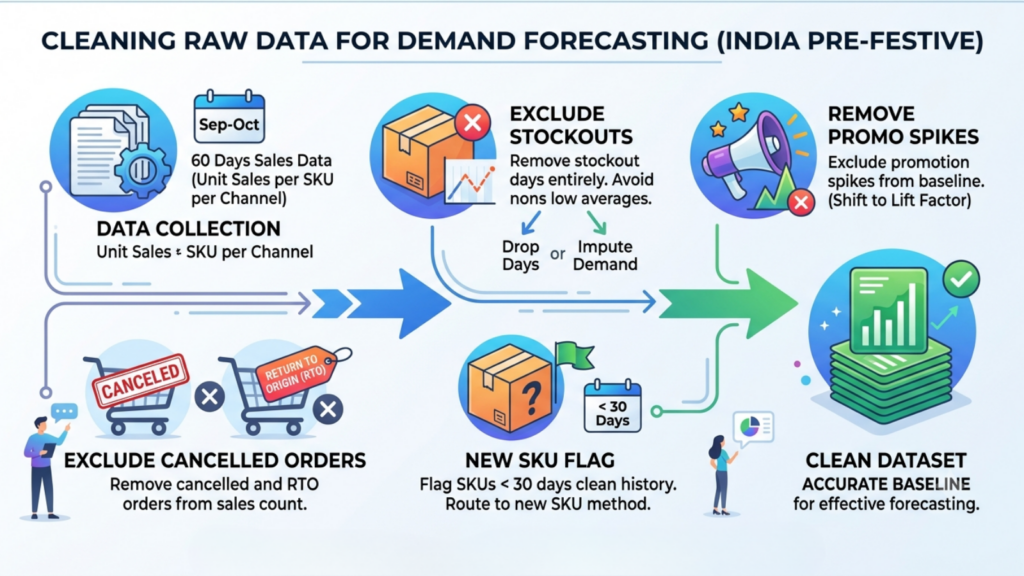
Every later step in how to forecast product demand before an ecommerce sale inherits whatever distortion you leave in the raw data, so this step is not optional preparation. It is the forecast.
Pull 60 days of unit sales per SKU per channel, then remove distortion:
- Exclude stockout days entirely. Do not average them in as low-demand days. Either drop them or impute demand from the surrounding period.
- Exclude prior promotional spikes from the baseline. They belong in your lift factor, not your baseline.
- Exclude cancelled and RTO’d orders if your sales report counts them as sold.
- Flag SKUs with fewer than 30 days of clean history and route them to the new-SKU method later in this guide.
Sixty days rather than ninety, because Indian demand shifts materially in the pre-festive build-up and a longer window drags in a structurally quieter period.
Step 2: Calculate a Weighted Baseline
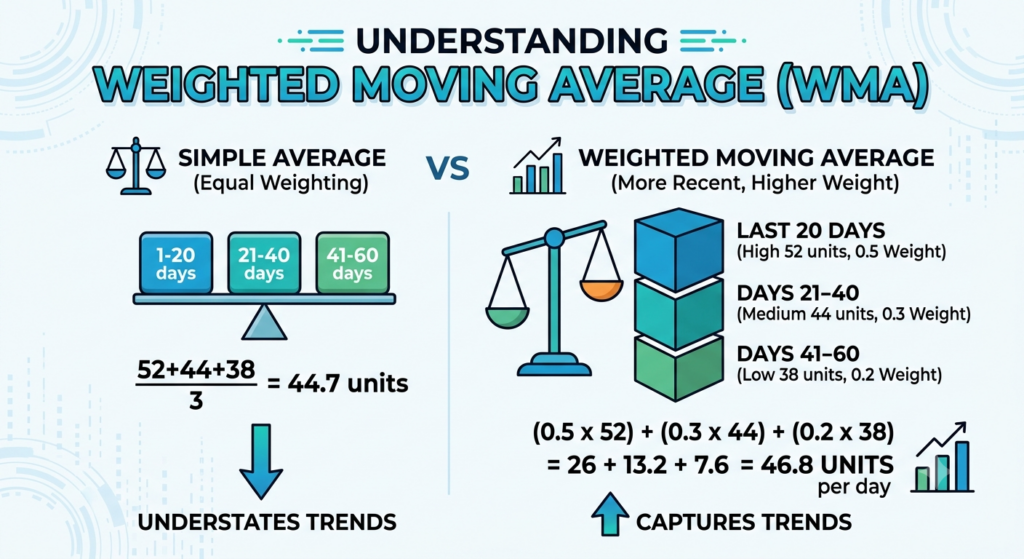
A simple average treats a sale sixty days ago as equal to a sale yesterday. Weight recent data more heavily.
A practical weighted moving average for a 60-day window:
Baseline daily velocity = (0.5 × avg daily units, last 20 days) + (0.3 × avg daily units, days 21-40) + (0.2 × avg daily units, days 41-60)
For a SKU averaging 52, 44, and 38 units per day across those three blocks: (0.5 × 52) + (0.3 × 44) + (0.2 × 38) = 26 + 13.2 + 7.6 = 46.8 units per day
A flat average would have given 44.7, understating a SKU that is visibly trending up. On a nine-day window, that is a 19-unit difference before any lift is applied.
Step 3: Derive Your Own Promotional Lift Factor
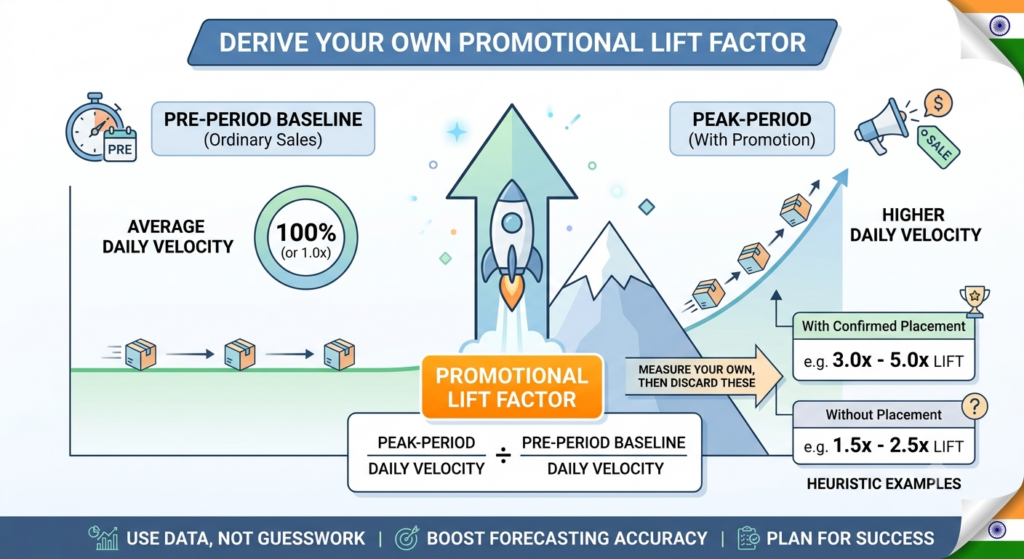
This is the step that separates a real forecast from a guess, and it is the single most important variable in how to forecast product demand before an ecommerce sale. It is also where most Indian sellers substitute intuition for measurement.
Lift factor = peak-period daily velocity ÷ pre-period baseline daily velocity
Calculate it from your own last two sale cycles, per SKU role, not per SKU. Group SKUs by how they were promoted:
|
SKU role in the sale |
Typical lift range |
Confidence |
|---|---|---|
|
Lightning deal/deal of the day |
6-10x |
Low without prior data |
|
Featured A-class, moderate discount |
3-5x |
Moderate |
|
Full-price catalogue SKU on incremental traffic |
1.5-2x |
Higher |
|
Long-tail C-class |
1-1.5x |
Higher |
These ranges are planning heuristics from common operating practice, not published benchmarks. Use them only until you have measured your own, then discard them.
If you secured a specific placement this cycle that you did not have last cycle, plan at the top of the band. If you have not confirmed placement, plan at the bottom.
Step 4: Apply the Commercial Window, Not the Official Dates
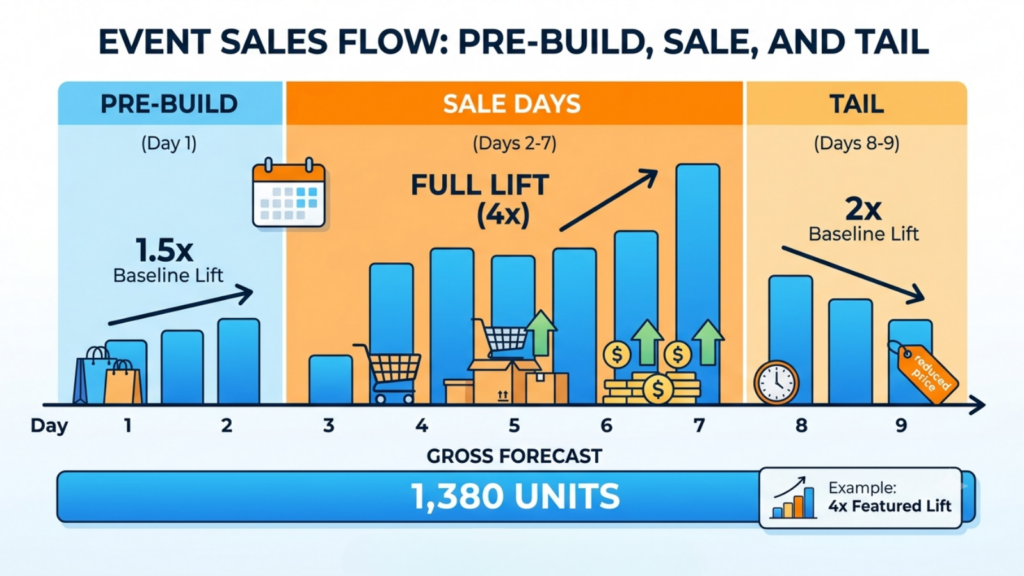
Traffic builds 24-48 hours before the announced start and does not return to baseline immediately after close.
For a six-day marketplace sale, model nine days: one day pre-build at roughly 1.5x baseline, six days at full lift, two days tail at roughly 2x baseline.
Gross forecast = (pre-build days × pre-build lift × baseline) + (sale days × full lift × baseline) + (tail days × tail lift × baseline)
Worked example on the SKU from Step 2, at a 4x featured lift:
Pre-build: 1 × 1.5 × 46.8 = 70 units
Sale: 6 × 4 × 46.8 = 1,123 units
Tail: 2 × 2 × 46.8 = 187 units- Gross forecast: 1,380 units
Step 5: Build Three Scenarios, Not One Number
Given that promotional MAPE commonly runs 25-35%, a single number carries an error you have not acknowledged.
|
Scenario |
Calculation |
Use |
|---|---|---|
|
Low |
Gross forecast × 0.7 |
Procure to this |
|
Base |
Gross forecast |
Contract to this |
|
High |
Gross forecast × 1.4 |
Hold optionality to this |
For the example: Low 966, Base 1,380, High 1,932.
Scenario planning is the practical answer to the accuracy limits described earlier: since how to forecast product demand before an ecommerce sale cannot deliver precision, it should deliver bounded exposure instead. Procure to the low case, secure supplier capacity contractually to the base case, and hold an option — not stock — to the high case. This is what turns forecast error from a loss into a manageable exposure.
Step 6: Adjust for Returns and RTO

India’s average RTO rate sits between 20% and 30%, against a global benchmark closer to 8-12%, with COD around 45% of D2C orders. Treat these as directional and verify against your own courier reports.
Two adjustments, in opposite directions:
- Add the units that will be dispatched and returned, because they consume stock even though they do not convert. A 25% RTO rate on the COD share of your forecast is real physical demand on your inventory.
- Subtract the sellable units expected to return inside the window, modelled as a separate late supply pool with a realistic sellable-condition rate.
Net these deliberately. Blending them into one assumption is a common source of error.
Step 7: Constrain by Supply and Cash

A forecast that exceeds what you can fund or what your supplier can deliver is not a forecast. It is a wish.
Check the low-case landed cost against your cash position, including the payout lag on marketplace settlements.
Confirm supplier capacity in writing against the base case.
Confirm inbound appointment availability at the fulfilment centres for the timing the plan requires.
If any constraint binds, reduce the long tail before reducing hero SKUs.
Step 8: Sanity-Check Against Two Independent Views
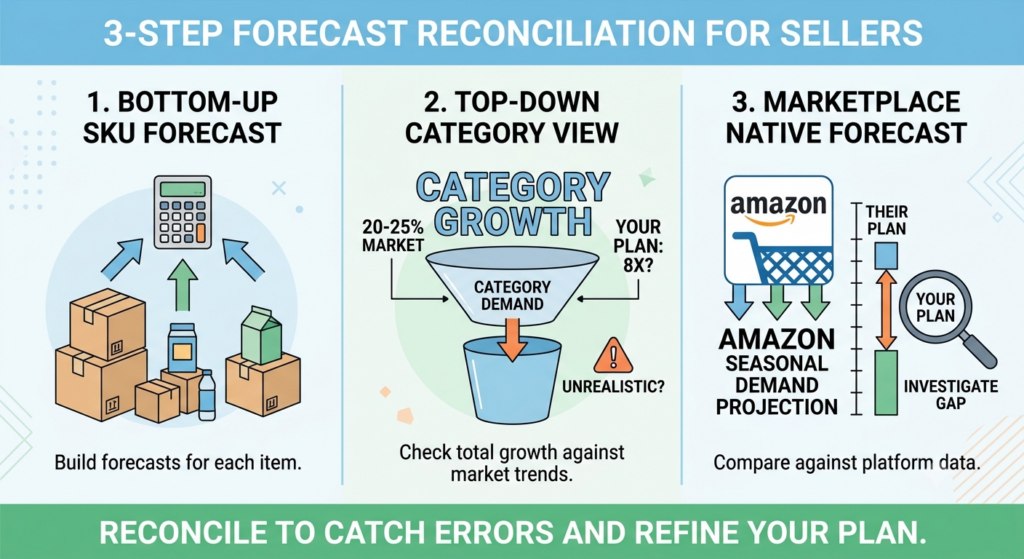
Compare your bottom-up SKU forecast against two other perspectives before committing:
- Top-down category view. Does the sum of your SKU forecasts imply a category growth rate you can defend? If your plan implies 8x growth in a category growing 20-25%, something is wrong.
- Marketplace native forecast. Where does Amazon’s seasonal demand projection sit relative to yours? A large divergence is worth investigating rather than dismissing.
Reconciling top-down and bottom-up is a discipline most Indian sellers skip, and it catches errors that no amount of SKU-level refinement will.
When the two views disagree materially, resolve the gap explicitly rather than averaging them. Averaging hides which view was wrong and removes the learning. Write down which one you chose and why, then check it after the sale.
Step 9: Convert the Forecast Into Allocation
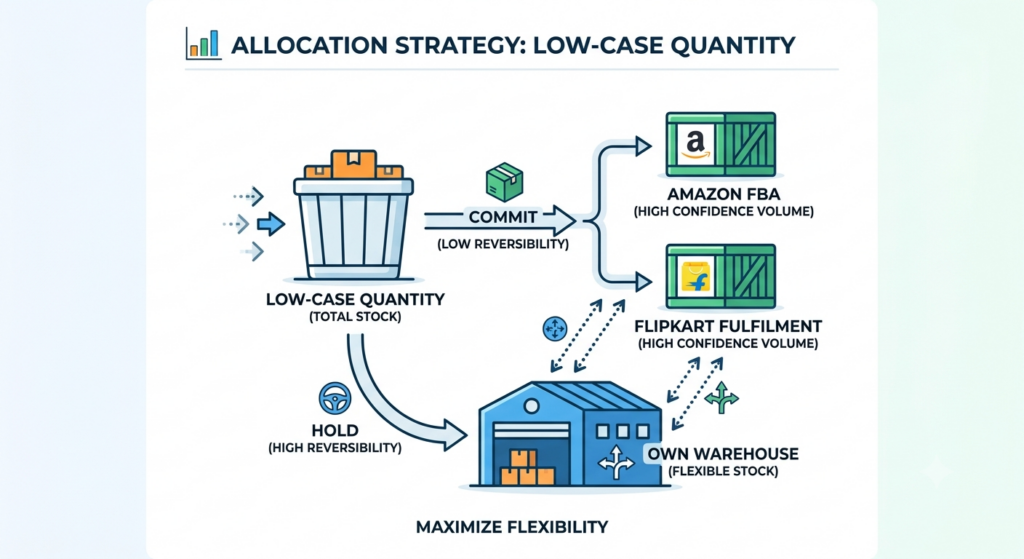
The forecast is not the decision. The allocation is.
Split the low-case quantity across pools according to reversibility: commit only high-confidence volume to Amazon FBA and Flipkart Fulfilment, and hold flexible stock in your own warehouse where you can point it at either platform mid-sale.
Step 10: Lock the Assumptions in Writing
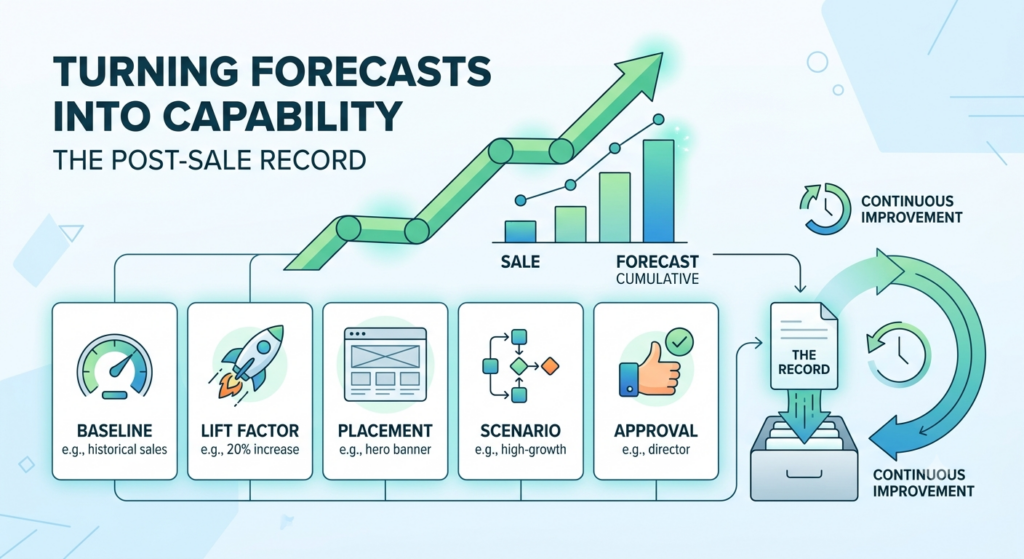
This final step is what turns how to forecast product demand before an ecommerce sale from a one-off exercise into a compounding capability.
Record the baseline, the lift factor used, the placement assumed, the scenario chosen, and who approved it.
This document is what makes next cycle’s forecast better. Without it, post-sale analysis degenerates into disagreement about what was assumed rather than measurement of what was wrong.
How to Forecast Demand for SKUs With No Sales History
New SKUs are where forecasting fails most visibly, and where the first two quarters commonly run 40-60% MAPE. That is expected, not a failure.
Four practical techniques:
- Analogue forecasting. Find the closest existing SKU by category, price band, and channel, then apply its baseline and lift factor with a discount for uncertainty. This is the most reliable method available without history.
- Attribute-based estimation. For fashion in particular, forecast at the attribute level — colour, size curve, price band — where you do have history, then allocate to the new SKU.
- Pre-order and waitlist signals. Where the launch precedes the sale, actual sign-up volume is a far better predictor than any model.
- Deliberate under-commitment. For genuinely novel SKUs, plan the low case and prioritise fast replenishment over deep stock. Selling out a new SKU is a recoverable error. Writing off 800 units of an unvalidated one is not.
A practical rule for new SKUs during Indian festive windows: cap any single new SKU at a fixed share of your total sales buy, regardless of how confident the team feels. Enthusiasm about a launch is not a demand signal, and the absence of history means there is nothing to correct an over-optimistic estimate against. If the SKU sells out in three days, the lost margin is finite, and the demand data you gain is worth more than the units.
Treat the first sale cycle for any new SKU as a measurement exercise rather than a revenue exercise. The lift factor you derive from it becomes a real input for every subsequent cycle, which is worth more than the incremental units a deeper buy would have delivered.
Understanding how to forecast product demand before an ecommerce sale for new SKUs mostly means accepting wider error bands and designing the supply plan so those bands are survivable.
How to Measure Whether Your Forecast Was Any Good: MAPE, WAPE and Bias
Measure within 14 days of the sale closing, at the level where you make ordering decisions. Skipping this step is why most sellers repeat the same error every cycle, and it is the reason why forecasting product demand before an ecommerce sale improves for some brands and never improves for others.
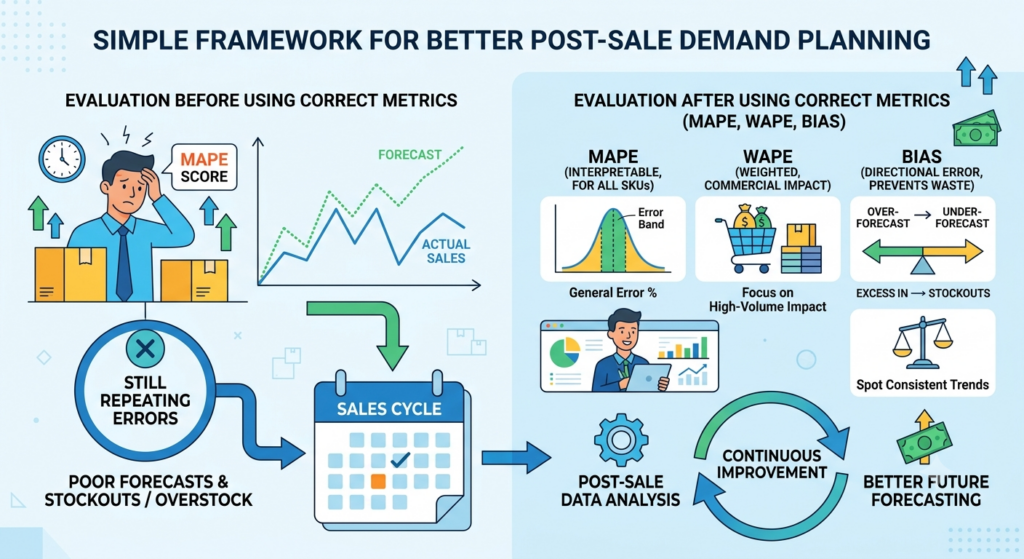
MAPE (mean absolute percentage error) averages the absolute gap between forecast and actual as a percentage of actual. It is interpretable and widely used, but it inflates dramatically on low-volume SKUs where the denominator shrinks, and it treats over- and under-forecasting symmetrically even though stockouts and overstock cost different amounts.
WAPE (weighted absolute percentage error) weights by volume, so it reflects commercial impact rather than SKU count. For a portfolio containing many slow movers, WAPE tells you more.
Bias tells you direction, which MAPE cannot:
Bias = (Sum of forecast − Sum of actual) ÷ Sum of actual × 100
Positive bias means systematic over-forecasting and excess inventory. Negative bias means systematic under-forecasting and stockouts.
Track both. Consistent bias in one direction is far more fixable than random error, because it usually points at a single wrong assumption rather than at model quality. If your bias runs persistently positive, the most common causes are a lift factor set from an unusually strong prior cycle, or a forecast quietly adjusted upward to match a revenue target.
|
Metric |
What it answers |
Watch for |
|---|---|---|
|
MAPE |
How large were the errors? |
Inflation on low-volume SKUs |
|
WAPE |
How large were the errors that mattered? |
Masking of long-tail problems |
|
Bias |
Which direction do I consistently miss? |
Persistent sign in one direction |
|
Sell-through |
Did I buy the right quantity? |
75-85% on A-class is a reasonable target |
|
Stockout hours |
Did error cost availability? |
Concentration on hero SKUs |
Sell-through and stockout targets are directional planning benchmarks, not published standards.
Seven Biases That Distort Indian Sale Forecasts
Method fails less often than judgement does. Any honest treatment of how to forecast product demand before an ecommerce sale has to name the human failure modes.
- Anchoring on last year’s actuals. Last year recorded what you supplied, not what customers wanted. Correct for stockout periods first.
- Forecasting to a revenue target. The fastest route to persistent positive bias. If the number is being adjusted to fit a plan, it is no longer a forecast.
- One lift factor for the whole catalogue. Guarantees understocked heroes and overstocked tail simultaneously.
- Forecasting at SKU level instead of SKU-channel level. Marketplace and D2C mixes diverge sharply during sales; the average describes neither.
- Treating placement as confirmed before it is. Plan the bottom of the lift band until the deal slot is in writing.
- Ignoring the second peak. The post-Diwali high-ticket wave is a separate demand event, not a tail.
- Never measuring afterwards. Without MAPE and bias by cycle, the same error repeats indefinitely, invisibly.
How Base.com Supports the Forecasting Loop

Base.com is an ecommerce operating system combining order management, product and inventory management, marketplace listing control, shipping, and workflow automation in one platform. Its Product Manager module explicitly combines ERP, WMS, and PIM functions.
Forecasting is only as good as the data underneath it, which is where a unified system matters more than a forecasting model.
Three of the inputs required for how to forecast product demand before an ecommerce sale come directly from the operating system rather than from a planner’s spreadsheet.
- Clean channel-level sales history. Orders from every connected channel land in one system, which is what makes SKU-channel forecasting possible without manual consolidation across marketplace dashboards.
- Accurate stock records. With Gartner data indicating 58% of retail and DTC brands run inventory accuracy below 80%, the inventory record is usually the weakest link. Base.com supports separate stock levels, documents, deliveries, and stocktakings per warehouse, so committed and available stock never blur together.
- Reservations at capture. Stock can be reserved before orders are paid, so unshipped COD orders are visible in available-to-promise rather than surfacing as a shortfall at picking.
- Live synchronisation and Accelerations. Stock sync runs every eight hours, hourly, or live, and a dedicated Accelerations module raises sync frequency for periods when higher sales are expected. Faster sync narrows the gap between forecast and executable reality.
- Post-sale reconciliation. Separate stocktakings per warehouse let you close one node at a time, which is what produces the clean actuals your next forecast depends on.
Mastering How to Forecast Product Demand Before an Ecommerce Sale Is a Loop, Not a Document
The brands that forecast well are not running better models. They are running the same method every cycle and measuring the error afterwards.
Clean the history. Weight the baseline. Derive lift from your own data. Model the commercial window. Build three scenarios. Net the returns. Constrain by cash and supply. Reconcile top-down against bottom-up. Allocate by reversibility. Record the assumptions.
Then measure MAPE and bias, and change one assumption for next cycle.
With Indian festive GMV projected to cross ₹1.15 lakh crore in a 30-35 day window and promotional error running roughly double normal levels, precision is not available. Discipline is. Base.com consolidates channel sales, inventory, and warehouse data into one source of truth, which is the input layer every step above depends on.
Forecast a range. Commit in stages. Measure the miss. Repeat.
Frequently Asked Questions
How far in advance should I forecast for a festive sale?
What forecast accuracy is realistic for a promotional period?
How do I forecast a new product with no sales history before a sale?
Should I use last year’s sales data directly as my forecast?
What is the single biggest mistake in how to forecast product demand before an ecommerce sale?



[…] alone: Can theoretically forecast demand using historical sales and procurement data, but most ERP forecasting modules update on a scheduled […]