
Indian sellers often calculate margins like a manufacturer, but selling online demands sharper tracking. If you do not know your real contribution margin D2C, scaling ads will only scale losses. India’s e-commerce market crossed INR 4,000 billion in 2024, which means higher competition, rising ad costs, and thinner margins for brands that do not track contribution properly.
Here is what many sellers miss while comparing with D2C benchmarks in India.
Returns are not small. In apparel and footwear, return rates can range between 25% to 40%. Even in beauty and electronics, 8% to 15% returns are common. Every return increases reverse logistics cost, damages inventory, and reduces your effective contribution margin D2C. If your AOV is INR 1,200 and reverse logistics costs INR 120 to 180 per order, your margin drops quickly.
COD is another hidden impact. In many categories, 50% to 70% of orders are still COD. RTO rates can go as high as 20% in tier 2 and tier 3 cities. That means you pay for forward and reverse shipping without revenue, directly hurting the contribution margin D2C.
On marketplaces, commissions range from 15% to 25%, depending on the category. Add payment gateway charges of 1.8% to 2.5%, plus shipping deductions. When you benchmark correctly against D2C benchmarks in India, you see why contribution tracking must include ads, COD risk, and platform costs, not just product margin.
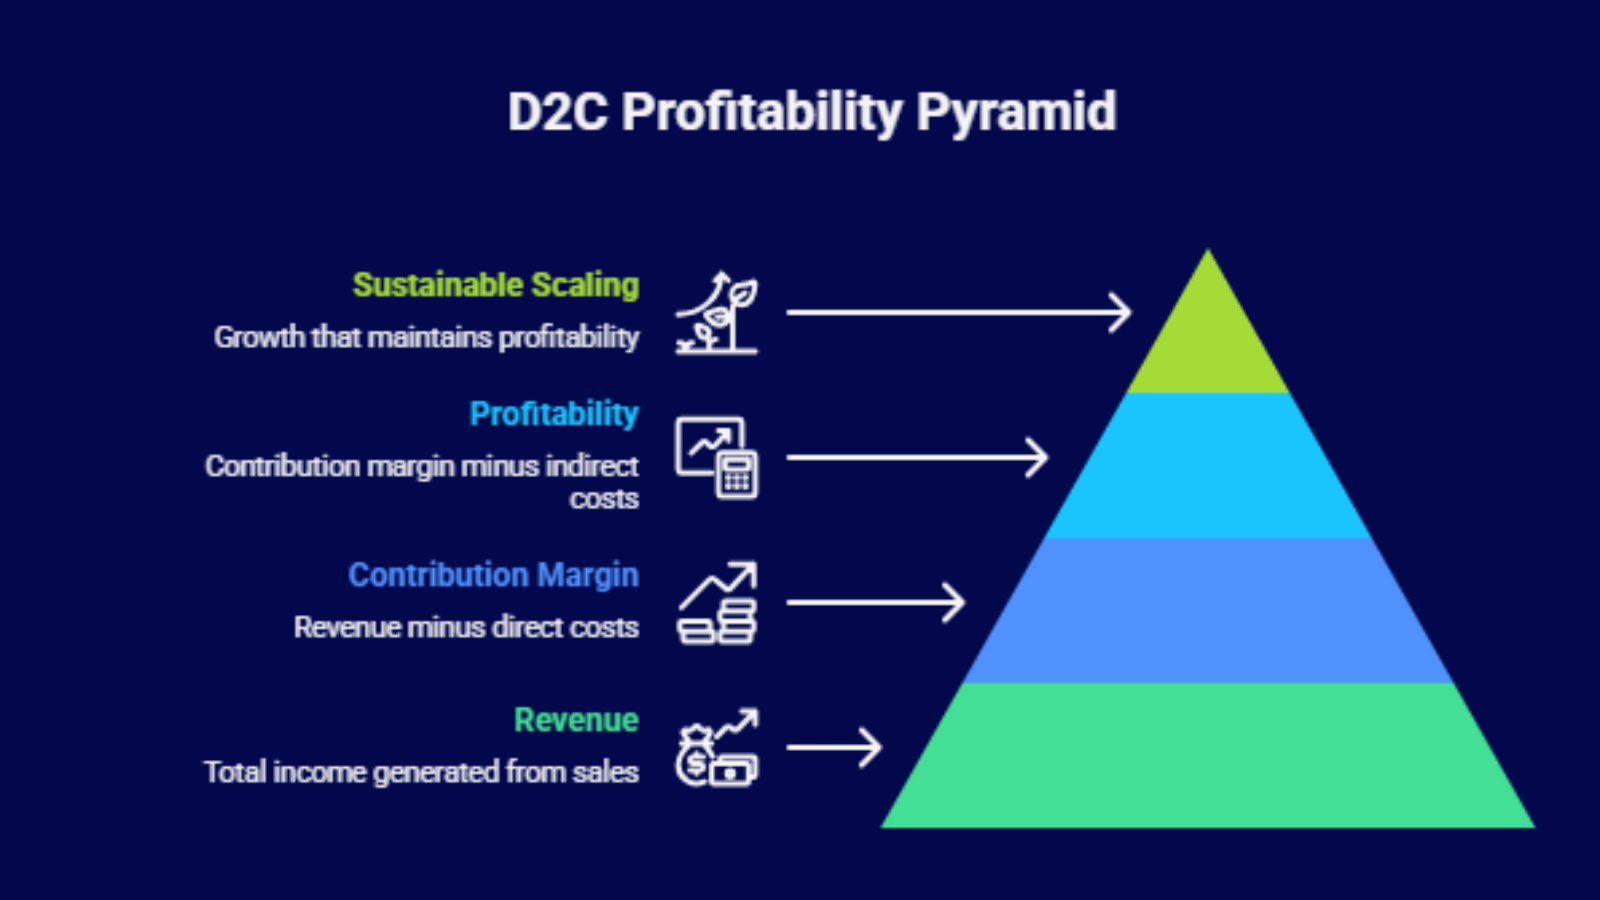
What Is Contribution Margin in D2C and Why Category Benchmarks Decide Survival
Before you chase revenue, you need to understand what actually stays in your business. Contribution margin D2C is the amount left after subtracting all variable costs from revenue. These costs go beyond manufacturing. They include the cost of goods sold, shipping, packaging, payment gateway fees, performance marketing spend, COD handling charges, return processing, and marketplace commissions if you sell on Amazon or Flipkart.
The formula is simple:
Contribution Margin = Revenue – Variable Costs
Contribution Margin % = (Revenue – Variable Costs) ÷ Revenue × 100
In practical terms, this is the money available to pay salaries, rent, tech tools, and still make a profit.
For Indian sellers, the nuance lies in hidden variable costs. Shipping can cost INR 60 to 120 per forward order and another INR 80 to 150 for reverse logistics. Payment gateway fees range from 1.8% to 2.5%. Marketplace commissions vary between 15% and 25% depending on category. Add 18% GST on ad spends, and your effective CAC increases immediately. If you ignore these, your contribution margin D2C calculation is incomplete.
This is where D2C benchmarks in India become critical. Categories behave very differently. Beauty brands may operate at 60% to 75% gross margins, while electronics may sit at 20% to 35%. Apparel often sees return rates above 25%, while supplements may see under 10%. Repeat purchase cycles also differ. Skincare may repeat in 45 days, but furniture may not repeat for years.
When you compare your numbers against relevant D2C benchmarks in India, you understand whether your CAC is sustainable, whether pricing needs revision, or whether logistics optimisation is required. Without tracking contribution margin D2C category-wise, scaling becomes risky rather than strategic.
Contribution Margin Benchmarks by Top D2C Categories in India
Below is a structured and practical view of realistic contribution margin D2C benchmarks across leading categories. These numbers are aligned with investor reports, brand disclosures, marketplace economics, and operating realities seen in D2C benchmarks in India. The idea is not just to know the numbers, but to understand what drives them and how to improve them at ground level.
1. Beauty and Personal Care
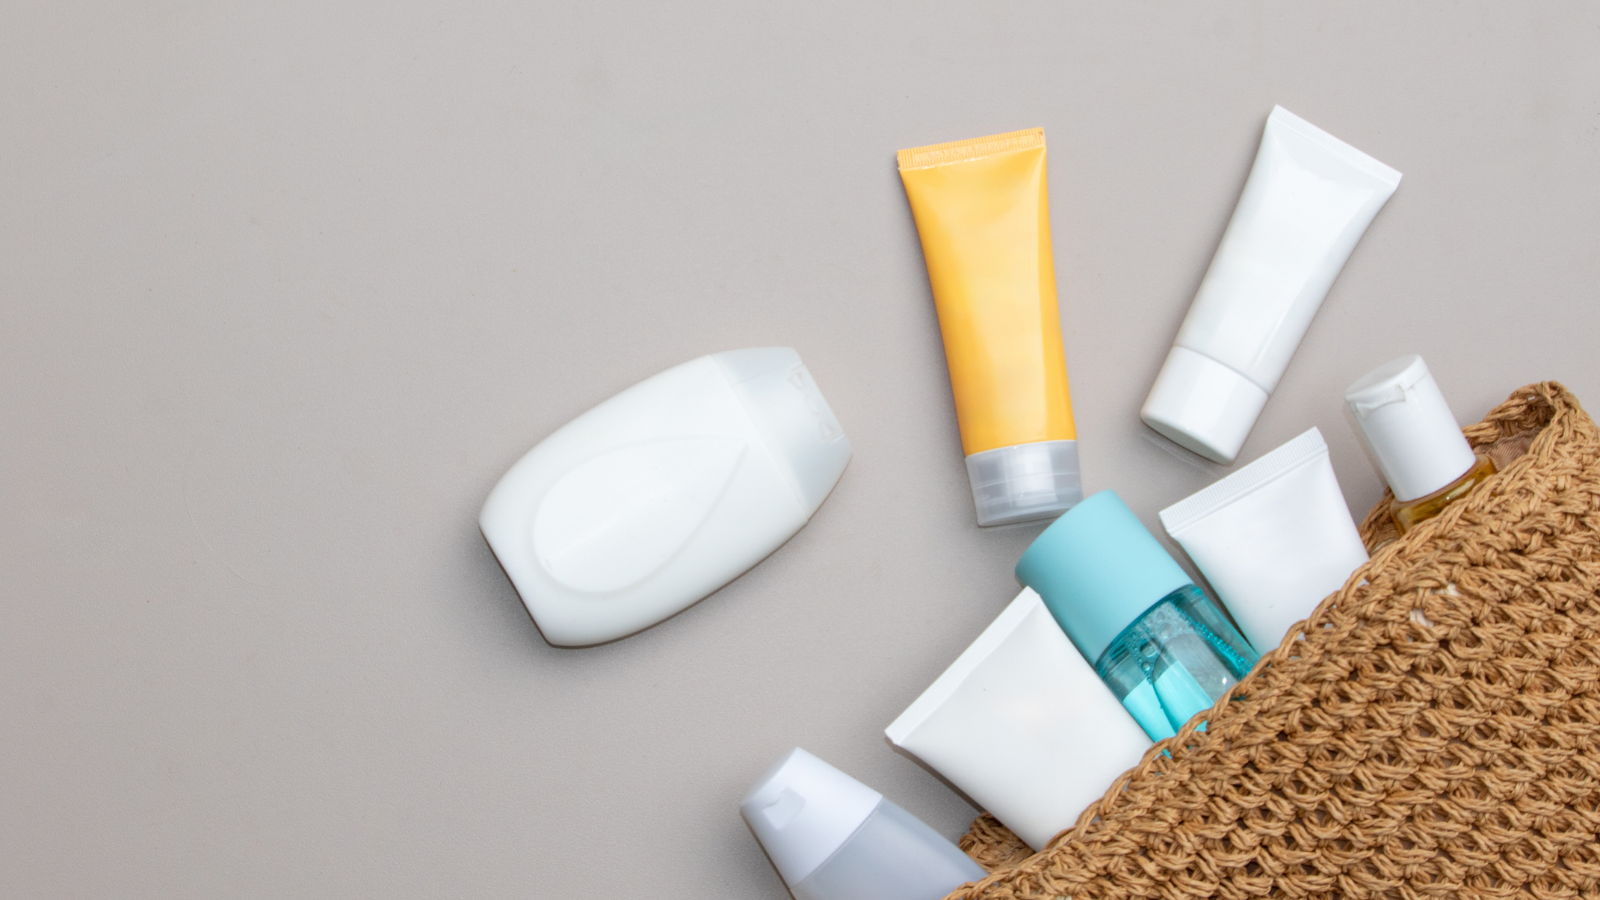 Beauty remains one of the strongest categories in terms of contribution margin D2C.
Gross Margin: 60% to 80%
Contribution Margin: 25% to 40%
Repeat Purchase Cycle: 30 to 90 days.
In India, skincare, haircare, and cosmetics brands benefit from strong perceived value and relatively low production costs compared to MRP. A serum manufactured at INR 120 to 180 can retail at INR 599 to 899. Shipping is lightweight, usually under 500 grams, keeping forward logistics between INR 50 to 80 for most zones.
Ad costs in beauty are competitive. CPMs can range from INR 150 to 350, depending on targeting. However, once repeat purchase kicks in, blended CAC drops. According to D2C benchmarks in India, brands that reach 30% plus contribution margin D2C typically have repeat revenue contributing at least 35% of monthly sales.
To improve contribution margin D2C in beauty, brands must focus on increasing AOV through bundles and kits rather than discounts. Negotiating better packaging rates, reducing leakage and damage, and optimising courier partners by zone can add 2% to 4% margin. Subscription refills and loyalty programs also reduce dependency on paid acquisition.
2. Fashion and Apparel
Fashion has attractive gross margins but an unstable contribution margin D2C.
Gross Margin: 50% to 70%
Contribution Margin: 10% to 25%
Return Rates: 20% to 35%
Apparel brands in India face one major issue: returns. Size mismatch, quality perception, and impulse buying increase reverse logistics. Forward shipping may cost INR 70 to 100, while reverse adds INR 100 to 150. With return rates above 25%, the effective logistics cost per successful order increases sharply.
Marketplaces also charge referral fees of 15% to 25%, plus closing fees and shipping deductions. Heavy discounting during sales further reduces the contribution margin D2C. Many brands show strong revenue but weak contribution because discounts and returns are not fully factored in.
Improving contribution margin D2C in fashion requires tighter inventory planning and better size charts. Detailed product descriptions, try-at-home options with prepaid incentives, and quality checks before dispatch reduce returns. Shifting focus to core SKUs instead of wide catalog expansion reduces dead stock and clearance discounts. According to D2C benchmarks in India, fashion brands that control returns below 18% see margin improvement of 5% to 7%.
3. Health and Nutrition
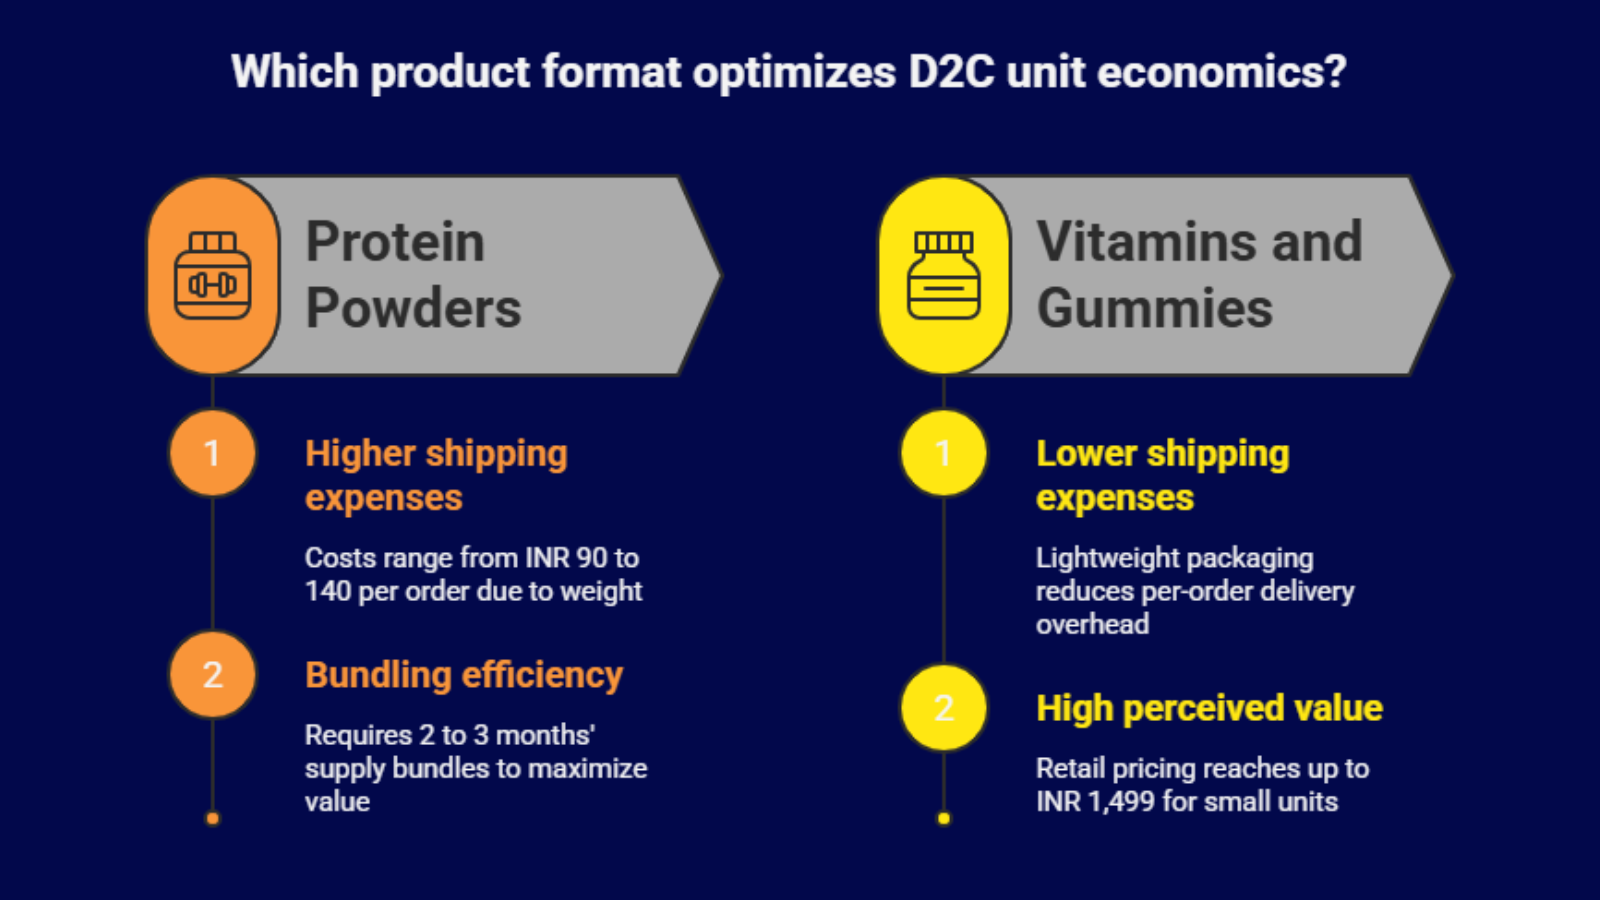 Supplements and protein brands operate on structured unit economics.
Gross Margin: 55% to 75%
Contribution Margin: 20% to 35%
Subscription Potential: High
Protein powders, vitamins, and gummies have high perceived value. A bottle costing INR 200 to 300 can retail at INR 899 to 1,499. Repeat purchase cycles range between 30 and 60 days. Subscription models are common, improving lifetime value.
Regulatory compliance is important in India. FSSAI labelling, batch testing, and certifications add cost but build trust. Shipping weight can be higher for protein tubs, increasing logistics cost to INR 90 to 140 per order.
To improve contribution margin D2C, brands should push subscription at checkout with 5% to 10% incentive rather than heavy discounting. Bundling 2 to 3 months’ supply increases AOV and reduces shipping cost per unit. Influencer marketing should focus on performance tracking rather than vanity collaborations. As seen in D2C benchmarks in India, health brands with subscription revenue above 40% maintain a stable 25% plus contribution margin D2C.
4. Home and Kitchen
This category varies significantly based on product size and fragility.
Gross Margin: 40% to 60%
Contribution Margin: 15% to 30%
Shipping Cost Impact: High
Home decor and kitchen tools may have decent gross margins, but breakage and volumetric weight increase logistics costs. Bulky packaging pushes shipping to INR 120 to 250 per order in many zones. COD rates in tier 2 and tier 3 cities remain high, often 50% plus.
Marketplace deductions also include packaging compliance requirements and return handling fees. According to D2C benchmarks in India, home brands with efficient packaging design see 3% to 5% better contribution margin D2C than peers.
Improvement comes from reducing package dimensions, switching to lighter materials, and negotiating volumetric weight slabs with courier partners. Encouraging prepaid orders through small incentives reduces RTO risk. Brands should also map pin code profitability, because remote areas may eat 8% to 10% more in logistics costs.
5. Electronics and Gadgets
 Electronics is margin-sensitive.
Gross Margin: 20% to 40%
Contribution Margin: 5% to 15%
Return Risk: Moderate
Consumer electronics and accessories often face price comparison pressure. Marketplaces dominate this category, and referral fees combined with advertising fees can cross 20%. Warranty claims and replacements also add hidden costs.
Shipping is usually safe, but fragile items increase packaging expense. Return fraud and part replacement issues are common risks.
Improving contribution margin D2C in electronics requires focusing on accessories and add-ons where margins are higher. Cross-selling cables, covers, and warranties improves blended margin. Direct website sales help avoid marketplace commission, but ad CAC must remain under 12% to 15% of revenue to sustain profitability, according to D2C benchmarks in India.
6. Baby and Kids Products
This is a trust-driven category with strong repeat.
Gross Margin: 50% to 70%
Contribution Margin: 20% to 35%
Customer Lifetime Value: High
Parents prioritise safety and quality over price. Products such as diapers, baby food, and skincare are repeated frequently. However, compliance and safety testing increase production costs.
Return rates are usually lower than fashion, around 8% to 15%, but COD remains high in non-metro cities. Logistics cost stays manageable due to lighter-weight SKUs.
To improve contribution margin D2C, brands should focus on subscription bundles such as monthly diaper packs. Educational content builds trust and reduces dependency on paid ads. According to D2C benchmarks in India, baby brands with a retention rate above 45% often maintain 25% plus contribution margin D2C.
7. Food and Beverage
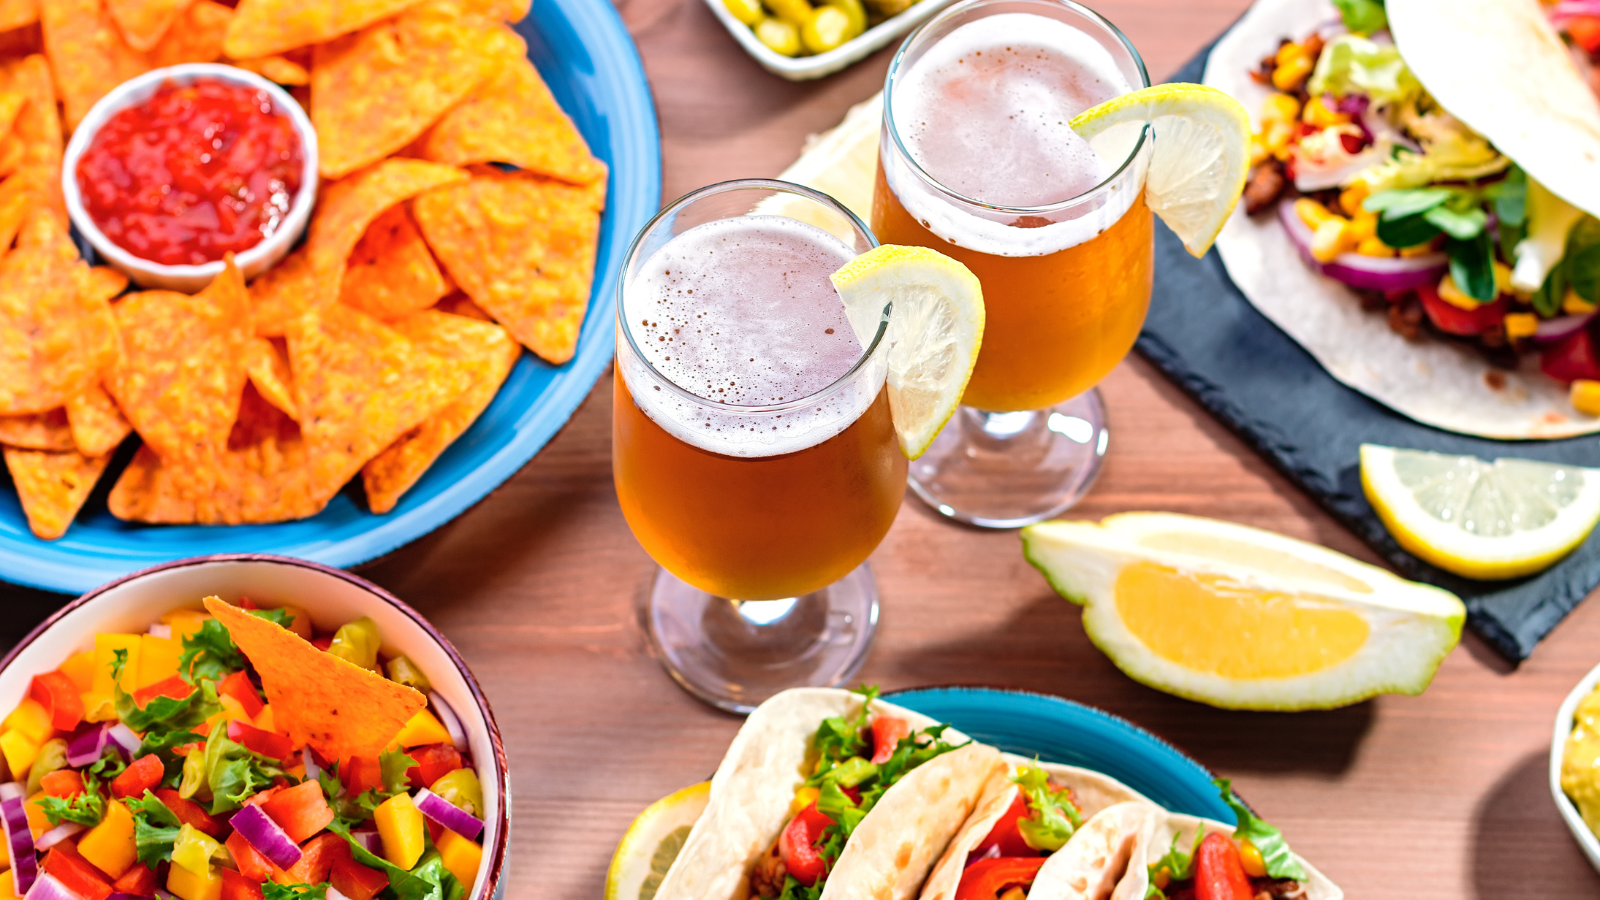 Food depends heavily on repeat frequency.
Gross Margin: 40% to 65%
Contribution Margin: 10% to 25%
Repeat Cycle: 15 to 45 days
Snack brands, healthy foods, and beverages face short shelf life issues. Expiry management is critical. Shipping cost becomes significant because the frequency is high. Cold chain products increase the cost further.
Marketplace platforms may charge storage and expiry penalties. Damage during transit also impacts the margin.
Improving contribution margin D2C in food requires pushing multi-pack bundles to increase AOV. Subscription coffee or snack plans reduce acquisition pressure. Forecasting demand accurately reduces wastage. As seen in D2C benchmarks in India, brands that maintain expiry losses under 2% of inventory protect 3% to 4% additional margin.
8. Furniture and Large Home Decor
Furniture is capital-intensive and logistics-heavy.
Gross Margin: 35% to 55%
Contribution Margin: 8% to 20%
Delivery Cost: Significant
Shipping large items can cost INR 800 to 2,000 per order, depending on the city. Installation and assembly add cost. Damage rates during transit can reach 5% to 10% if the packaging is weak.
Marketplaces also charge heavy referral fees for furniture. Returns are expensive because reverse pickup of large items is complex.
To improve contribution margin D2C, brands must invest in supply chain partnerships and regional warehouses to reduce shipping distance. Flat-pack design reduces volumetric weight. Clear product dimensions and assembly videos reduce returns. According to D2C benchmarks in India, furniture brands that optimise zone-based warehousing improve contribution margin D2C by 4% to 6%.
Across all categories, contribution margin D2C improves when brands treat logistics, returns, payment fees, and ad efficiency as controllable variables. Tracking pin code level profitability, pushing prepaid incentives, reducing RTO through order confirmation calls, negotiating 3PL contracts quarterly, and aligning pricing with real D2C benchmarks in India are not optional steps. They are survival strategies in the Indian market.
| Category | Gross Margin | Contribution Margin | Key Cost Pressure | Repeat Strength | Benchmark Insight (India) |
|---|---|---|---|---|---|
| Beauty & Personal Care | 60% – 80% | 25% – 40% | Ad CAC | High | 30%+ contribution margin D2C achievable with 35% repeat revenue |
| Fashion & Apparel | 50% – 70% | 10% – 25% | Returns & Discounting | Medium | Returns above 25% can reduce margin by 5% to 8% |
| Health & Nutrition | 55% – 75% | 20% – 35% | Compliance & CAC | High | Subscription-led brands sustain 25%+ contribution margin D2C |
| Home & Kitchen | 40% – 60% | 15% – 30% | Volumetric Shipping | Medium | Packaging optimisation improves margin by 3% to 5% |
| Electronics & Gadgets | 20% – 40% | 5% – 15% | Marketplace Fees | Low | Accessory bundling is critical to protect the contribution margin D2C |
| Baby & Kids | 50% – 70% | 20% – 35% | Trust Building Costs | High | 45%+ retention supports stable D2C benchmarks in India |
| Food & Beverage | 40% – 65% | 10% – 25% | Expiry & Logistics | High | Multi-pack bundling protects 3% to 4% margin |
| Furniture & Large Decor | 35% – 55% | 8% – 20% | Heavy Logistics | Low | Zone-based warehousing improves contribution margin D2C by 4% to 6% |
What Good Looks Like in D2C benchmarks in India
Healthy brands do not optimise for revenue. They optimise for contribution margin D2C. In India, strong operators typically target 25% plus contribution margin in beauty and health, 20% plus in baby, 15% plus in home, above 10% in fashion, and at least a positive contribution in electronics after ad spend. These targets align with practical D2C benchmarks in India and reflect sustainable scaling.
 With rising CAC and increasing logistics costs, even a 3% to 5% drop in contribution margin D2C can wipe out profitability. That is why tracking monthly, at the SKU and channel level, is critical. You need to know which product is profitable after ads, which marketplace is eating margin through commissions, and which pin codes are increasing RTO losses.
This is where Base Analytics makes a difference. The Base Analytics Profitability Dashboard gives real-time visibility into contribution margin D2C by SKU, campaign, and sales channel. It automatically pulls in ad spend, shipping cost, payment gateway fees, marketplace commissions, and return impact to show true net contribution. Instead of relying only on ROAS, you see actual margin after variable costs.
The Cohort and Retention Analytics module inside Base Analytics shows how repeat purchases improve contribution margin D2C over time, helping you compare your performance with real D2C benchmarks in India.
If you want clarity before scaling, Base Analytics helps you measure what actually matters.
Frequently Asked Questions
1. What is a good contribution margin for D2C brands in India?
A good contribution margin D2C depends on the category. Beauty and health brands should aim for 25% to 35%, while fashion and food may operate between 10% and 25% as per D2C benchmarks in India.
2. Why is contribution margin more important than revenue?
Revenue without a healthy contribution margin D2C leads to losses. Contribution margin shows how much money is left after variable costs and reflects true scalability according to D2C benchmarks in India.
3. How often should brands track contribution margin?
Brands should track contribution margin D2C weekly at a minimum. Comparing monthly performance with D2C benchmarks in India helps identify early warning signs before losses increase.
4. Can contribution margin improve without increasing prices?
Yes. You can improve contribution margin D2C by reducing shipping costs, improving ad efficiency, increasing AOV, and reducing returns while aligning with realistic D2C benchmarks in India.
5. Do benchmarks differ for new and mature brands?
Yes. Early-stage brands may have a lower contribution margin D2C due to higher customer acquisition costs. Mature brands typically align closer to stable D2C benchmarks in India after repeat cycles improve.