

To manage product discounts without losing profit margin, measure every bundle and promotion against the blended contribution rate of its components sold separately, cap discount depth by margin tier, and set system-enforced floors that automation cannot cross. AOV lift is not the test. Contribution rupees per order is.
A bundle can raise AOV 30% and leave you earning exactly what you did before.
The Uncomfortable Arithmetic Behind How to Manage Product Discounts Without Losing Profit Margin
Bundles are the most over-claimed lever in ecommerce pricing. The AOV lift is usually real. The margin outcome frequently is not.
Benchmark analysis puts well-built DTC bundle AOV lift at roughly 15-30%, with mix-and-match and build-a-box formats at the top of that range. Other sources report 20-35%, with best-in-class implementations reaching 55%.
Then the finding that matters: a 15% bundle discount that lifts AOV 30% drops contribution margin 6-7 points unless more than 20% of bundle orders are genuinely incremental.
Read that carefully. The lift is real, the margin still falls, and the difference is entirely whether the bundle created demand or repackaged demand you already had.
This is the core problem in how to manage product discounts without losing profit margin: the headline metric moves in the right direction while the number that pays your bills moves in the wrong direction.
Cost inflation has narrowed the room for error. US Bureau of Labor Statistics producer price index data shows the courier and parcel series rising roughly 67% between December 2019 and May 2026, and 2026 carrier general rate increases ran 5.9% at both UPS and FedEx. Those are US figures, but Indian sellers have faced comparable directional pressure on logistics and fulfilment costs.
The Blended Contribution Test: The Core of How to Manage Product Discounts Without Losing Profit Margin
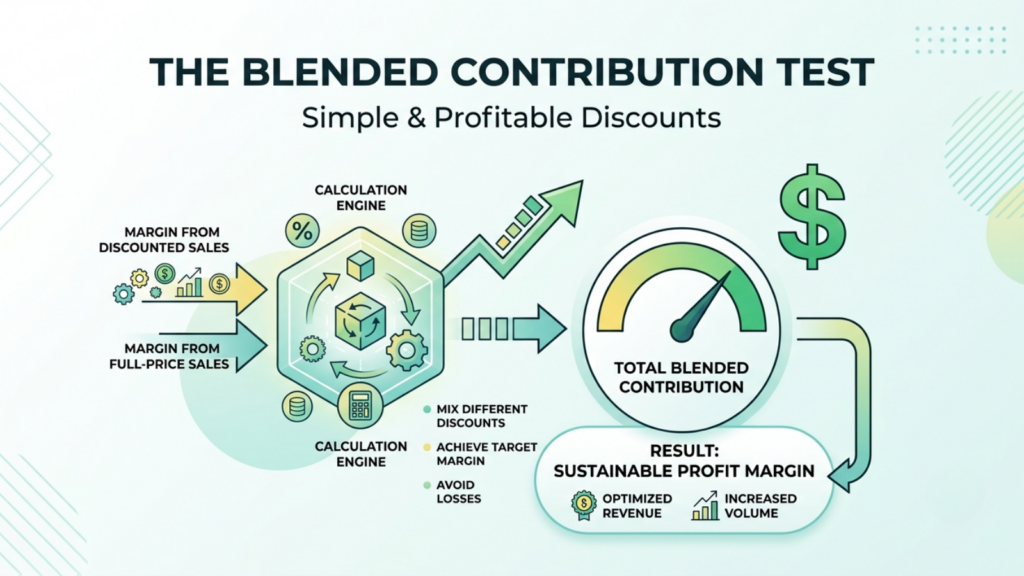
There is one test that settles whether a bundle or a promotion protects margin. It is simple, and almost nobody runs it.
Step 1. For each item in the bundle, calculate its contribution in rupees: price minus COGS minus its share of variable costs.
Step 2. Sum those contribution rupees.
Step 3. Divide by the sum of the item prices.
That blended rate is the benchmark the bundle has to beat. If the bundle’s contribution margin rate falls below the weighted single-item average, the bundle is diluting margin even when AOV is higher.
A worked illustration on a three-item kit:
|
Item |
Price |
Contribution |
CM rate |
|---|---|---|---|
|
Anchor SKU |
₹1,200 |
₹300 |
25% |
|
Accessory A |
₹400 |
₹220 |
55% |
|
Accessory B |
₹300 |
₹165 |
55% |
|
Sum |
₹1,900 |
₹685 |
36.1% blended |
The blended benchmark is 36.1%. Now price the bundle at ₹1,615, a 15% discount against buying separately.
Component costs do not change, so contribution falls by the full ₹285 discount to ₹400. Contribution rate becomes ₹400 ÷ ₹1,615 = 24.8%.
That is 11.3 points below the blended benchmark, and the gap has to be funded from somewhere real. The bundle only makes sense if the fulfilment saving and genuine incrementality cover the gap.
The fulfillment saving is the honest funding source. One bundle order is one pick sequence, one box, one label, one courier handover instead of three. If that saves you ₹120 per order, contribution rises to ₹520 and the rate to 32.2%, still below benchmark, but the gap is now recoverable through incrementality.
Anyone serious about how to manage product discounts without losing profit margin should run this test before launching any bundle, and should be able to name which cost line funds the discount.
Where Margin Actually Leaks for Indian Sellers
Before fixing anything, it helps to know that how to manage product discounts without losing profit margin is mostly about plugging leaks rather than about choosing percentages.
Discount decisions are rarely the whole story. Margin escapes through seven routes, and most are operational rather than commercial.
|
Leak |
Mechanism |
Where it surfaces |
|---|---|---|
|
Stacked discounts |
Platform layer plus coupon plus bank offer compound |
Settlement, weeks later |
|
Unbounded repricing |
Automation races competitors below your floor |
Silently, per unit |
|
Component drift in bundles |
Component stock diverges from records |
Mispicks and phantom availability |
|
Fee changes |
Marketplace fee revisions applied to old price lists |
Settlement reconciliation |
|
Returns understatement |
Floor calculated without expected returns cost |
Every unit of a high-return SKU |
|
Cannibalisation |
Bundle replaces full-price single sale |
Nowhere; it looks like growth |
|
Clearance leakage |
Clearance-depth pricing applied to core SKUs |
Core catalogue margin |
Cannibalisation is the most dangerous because it is invisible in every standard report. Bundle sales rise, single-SKU sales of the same anchor fall by a similar volume, total contribution is flat, and the dashboard shows a successful bundle programme.
The detection method: track anchor SKU total units, bundled and unbundled together, against the pre-bundle baseline. If total units are flat while bundle share rises, you discounted existing demand.
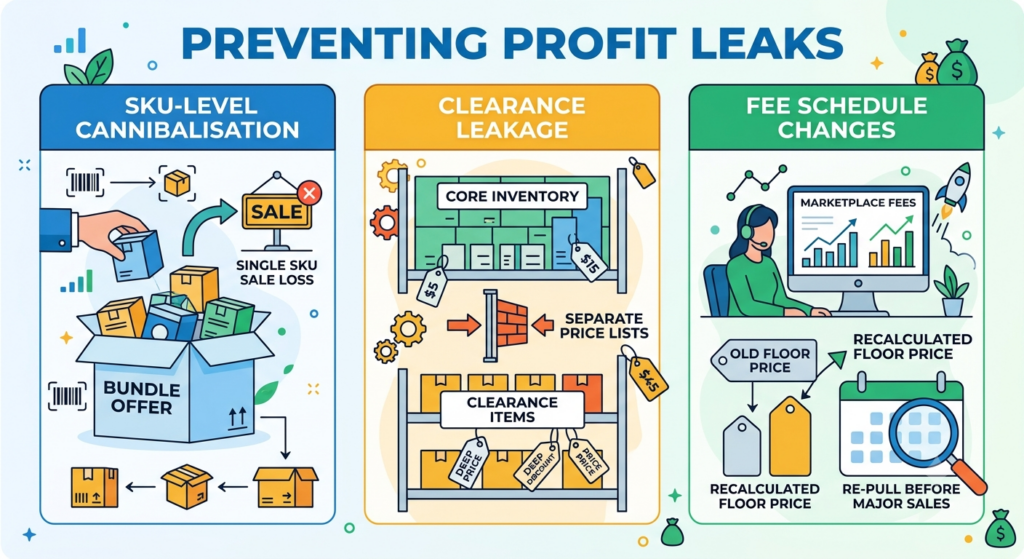
Run this check at SKU-family level rather than catalogue level. Cannibalisation is local; a bundle typically eats the specific single-SKU sale it contains, not sales across your range, so a catalogue-wide view will average it away entirely.
Clearance leakage deserves its own note because it is the most preventable leak on the list. It happens when a bulk price edit applies clearance-depth pricing to SKUs that were never meant to be cleared, usually because clearance and core prices live in the same price list. Separating them structurally removes the failure mode rather than managing it.
Fee changes are the quietest leak. Marketplaces revise referral, fulfilment and storage fees on their own schedules, and a price list built against last season’s fee table produces a floor that is no longer a floor. Re-pull fee schedules before every major sale rather than annually, and treat any change as a trigger to recalculate floors across affected categories.
None of these seven leaks is exotic. What they share is that each one operates below the level of the reports most teams actually read, which is why how to manage product discounts without losing profit margin is more a monitoring discipline than a pricing one.
Industry-Wise Margins on Bundles: Standards and Statistics
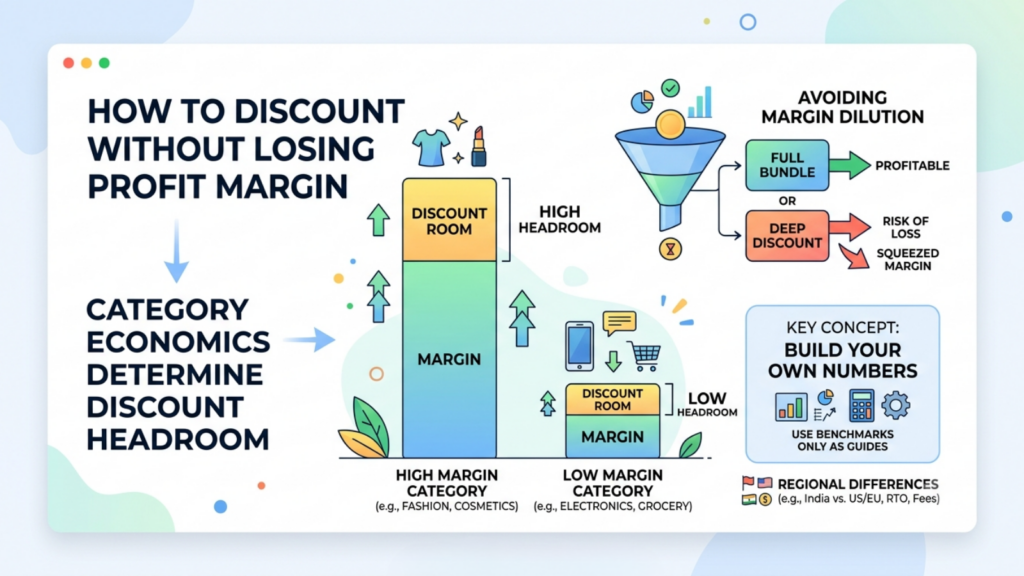
How to manage product discounts without losing profit margin depends heavily on what you sell, because category gross margin sets the discount headroom available before dilution begins.
Category economics determine how much discount room exists before a bundle dilutes margin. This section brings the published benchmarks together.
A necessary caveat first. Almost all of these figures are US and European, dollar-denominated, and drawn from Shopify-heavy panels, SEC filings of public DTC brands, or vendor-published research. Indian marketplace sellers operate at lower AOVs with higher RTO and different fee stacks. Use these to understand the shape of category economics, then build your own numbers.
Published Gross Margin by Category
|
Category |
Gross margin benchmark |
Bundle discount headroom |
|---|---|---|
|
Beauty and personal care |
65-85% (premium DTC targets) |
Widest; supports 15-20% depth |
|
Supplements and wellness |
65-78% |
Wide; multipacks work well |
|
Apparel and fashion |
50-65% |
Moderate on gross, narrow after returns |
|
Home and kitchen |
Moderate |
Narrow; parcel cost dominates |
|
Food and beverage |
Below 35% |
Narrowest; depth rarely recoverable |
|
Consumer electronics |
Thin |
Very narrow; accessory margin only |
Median gross margin for public DTC sits at 47%, with apparel and beauty above 55% and food and beverage below 35%. Mass-market or commodity products typically run 10-20 percentage points lower than the premium DTC targets above.
Published AOV by Category
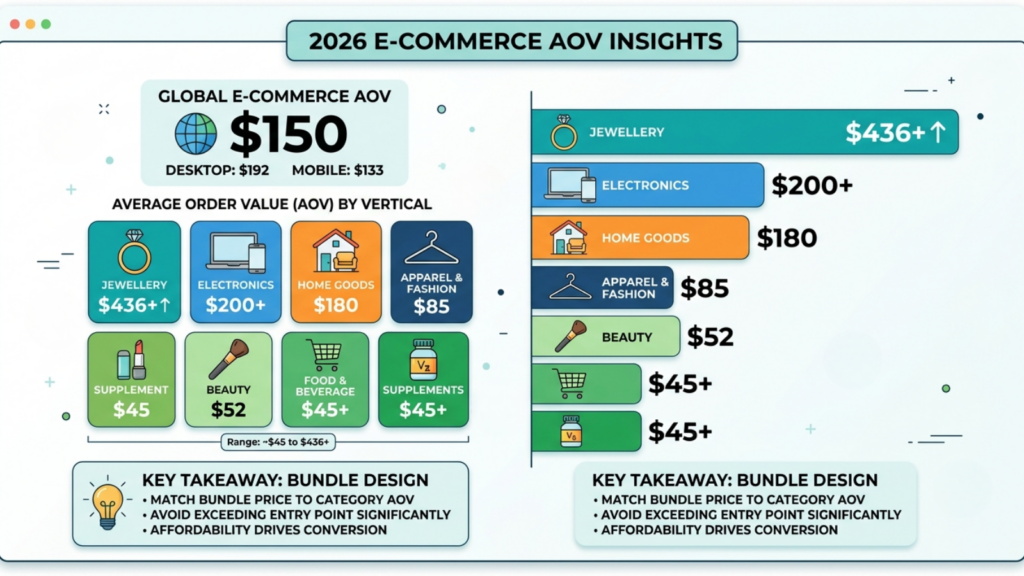
AOV ranges from roughly $45 to $436+ across ecommerce verticals in 2026, with jewellery and electronics leading and food and beverage and supplements trailing. Vertical medians reported include apparel around $85, beauty around $52, and home around $180. Global ecommerce AOV sits near $150, with desktop at $192 against mobile at $133.
Category AOV matters for bundle design because a pure bundle priced far above the category entry point does not convert. A $200 beauty bundle offered to a $52-AOV audience fails on affordability, not on value perception.
Published Discount Depth Norms
|
Metric |
Published figure |
|---|---|
|
Typical headline bundle discount |
10-20% |
|
Recommended depth below 50% margin |
5-10% |
|
Median ecommerce promo depth 2026 |
~15%, across roughly 93,000 merchants |
|
Average ecommerce promo depth 2026 |
~19.5% |
|
Contribution cost per added discount point |
~1.7 points |
That last row deserves emphasis. Each additional point of discount costs roughly 1.7 points of contribution, because the discount comes entirely out of margin while the cost base stays fixed.
The 5-10% guidance for sub-50% margin businesses is the single most actionable number here. Most Indian marketplace sellers in electronics, home and food sit below 50% gross margin, which means bundle discounts in the 15-20% range that read as normal are, for them, well outside safe.
Normal is not the same as safe. Category convention is set by whichever competitors are most willing to lose money, and matching it without checking your own blended benchmark is how a discount programme becomes a slow write-off.
The practical implication is that you should know your own cap before you look at what competitors are doing. Working the other way round, observing market depth, then reverse-engineering a justification, is how most margin erosion begins.
Published Bundle Performance Figures
|
Metric |
Published figure |
Source quality |
|---|---|---|
|
AOV lift from bundles |
15-30% (some sources 20-35%) |
Multiple vendor sources, consistent |
|
Best-in-class AOV lift |
Up to 55% |
Vendor-published |
|
Bundle upsell acceptance rate |
6-10% |
Vendor-published |
|
Conversion improvement |
15-25% |
Vendor-published |
|
Bundled customer LTV vs single-item |
2.7x |
Vendor-published |
|
Contribution drop from 15% discount at 30% AOV lift |
6-7 points unless >20% incremental |
Vendor-published, methodology disclosed |
Treat the LTV and best-in-class figures with more scepticism than the AOV lift range. The lift range appears consistently across independent sources; the headline outcome figures come from companies selling bundling software.
What This Means by Category
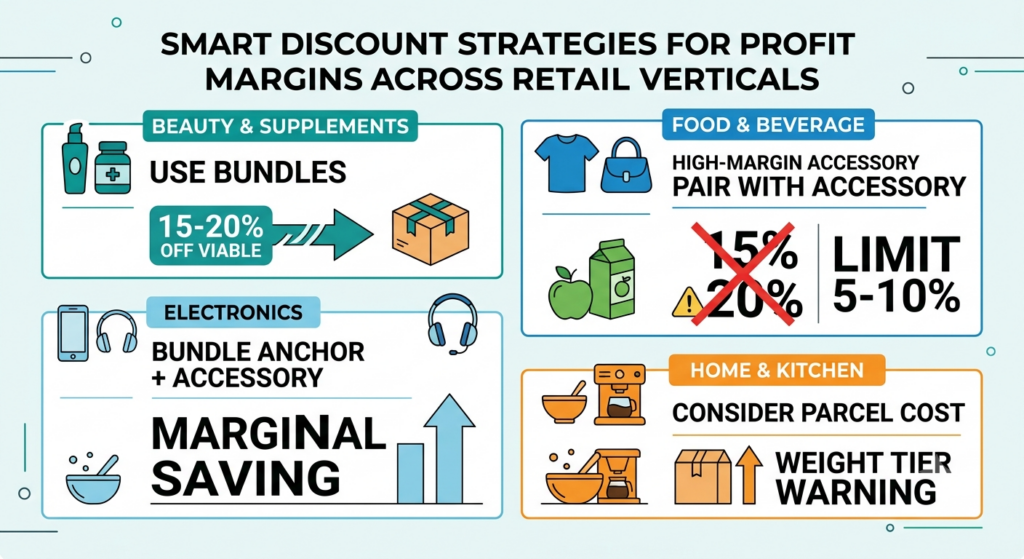
Translating those benchmarks into how to manage product discounts without losing profit margin looks different in each vertical.
- Beauty and supplements have the most room. High gross margins mean a 15-20% bundle discount can still clear the blended benchmark once fulfilment savings are counted. Routine kits and multipacks are the natural formats.
- Fashion looks like it has room on gross margin and does not have it on contribution. Indian return rates commonly reported at 25-30% mean the returns line consumes much of the apparent headroom, and bundle returns come back whole. Calculate the blended benchmark after returns, always.
- Electronics has almost no room on the anchor. The only viable structure is anchor plus high-margin accessory, with the entire discount funded by accessory margin and fulfilment saving.
- Food and beverage sits below 35% gross margin, where the published guidance caps depth at 5-10%. A 15% multipack discount in this category is very likely dilutive.
- Home and kitchen faces parcel cost as the binding constraint. A bundle that pushes the shipment into a higher weight or dimensional tier can consume the entire fulfilment saving that was meant to fund it.
Guardrails: Making the Floor Something Automation Cannot Cross
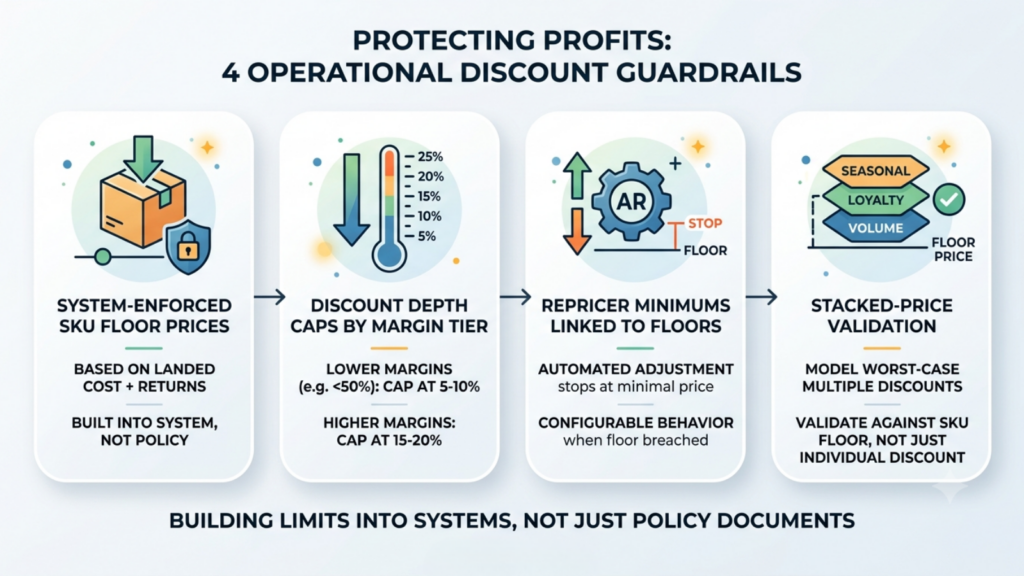
Knowing your numbers is not the same as protecting them. Understanding how to manage product discounts without losing profit margin operationally means building limits into systems rather than into policy documents.
Four guardrails worth implementing:
- SKU-level floor prices, held in the system. Calculated from landed cost including expected returns, stored as a price group, and referenced by every other pricing mechanism.
- Depth caps by margin tier. Sub-50% margin SKUs capped at 5-10%; higher-margin SKUs at 15-20%. Enforced at configuration, not at review.
- Repricer minimums derived from floors. Platforms including Base.com allow a defined minimum below which automated adjustment will not go, with configurable behaviour when the calculated price would breach it: apply the minimum, apply default margin, leave unchanged, or use warehouse price.
- Stacked-price validation. Model the worst case where every discount layer fires on one order, and validate that against the floor rather than validating your own discount alone.
Guardrails are where how to manage product discounts without losing profit margin stops being analyzed and becomes configuration.
Separate price groups by purpose. Keeping clearance pricing in its own price group is what stops clearance depth leaking onto core SKUs during a bulk edit. This single structural choice prevents one of the seven leaks entirely.
Governance: Who Can Approve What
Margin usually leaks through decisions made quickly by people without the cost data in front of them.
A workable approval structure:
|
Discount depth |
Approval level |
Requirement |
|---|---|---|
|
Within tier cap |
Category owner |
Floor check only |
|
Above tier cap, below floor + 5% |
Commercial head |
Blended contribution test documented |
|
Below floor |
CFO or founder |
Written strategic rationale and recovery plan |
|
Any mid-sale change |
Named on-shift owner |
Logged, with reason |
The point is not bureaucracy. It is that a below-floor decision should be a deliberate, recorded strategic choice rather than something that happens at 11 PM on day three of a sale.
Keep the tiers few and the thresholds unambiguous. An approval matrix that requires interpretation gets bypassed under pressure, which defeats its purpose precisely when it matters most. Three tiers that everyone can recite beat seven tiers nobody consults.
Give the on-shift owner real authority within their tier. Governance that forces every mid-sale decision upward produces delay, and during a sale window a delayed decision usually costs more than a slightly wrong one made quickly. The structure exists to bound the downside, not to centralise every call.
This governance layer is the part of how to manage product discounts without losing profit margin that no software provides. Floors, caps and repricer minimums can all be configured; deciding who may override them, and recording why, remains a human system.
Reconciliation: How to Manage Product Discounts Without Losing Profit Margin After the Sale
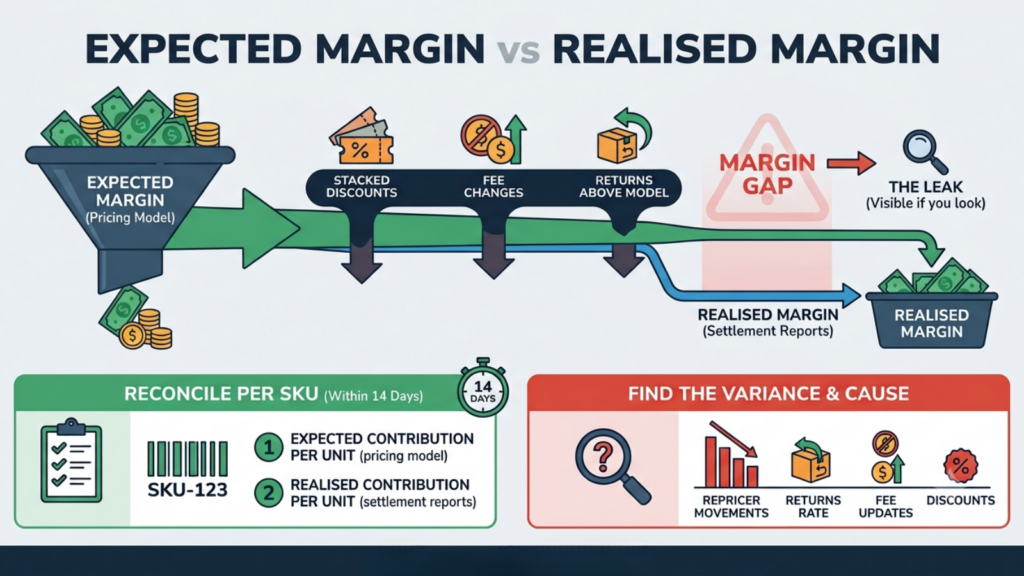
Expected margin and realised margin diverge. The gap is your leak, and it is only visible if you look.
Within 14 days of a sale, reconcile per SKU:
Expected contribution per unit, from your pricing model.
Realised contribution per unit, from settlement reports.
The variance, and its cause.
Common causes, in rough order of frequency: stacked discounts deeper than modelled, fee changes not reflected in the price list, returns above the modelled rate, and repricer movements below the intended level.
Do this per SKU, not in aggregate. An aggregate variance of 2% can hide a 20% leak on one SKU family offset by overperformance elsewhere.
Settlement reports are the only source that reflects what actually happened rather than what was configured. Everything upstream- your pricing model, your price groups, your approved discount schedule- describes intent. The settlement report describes the outcome, and the distance between them is the entire subject of this article.
Give the reconciliation a named owner and a fixed date. Work that belongs to everyone belongs to no one, and margin reconciliation is unglamorous enough that it slips indefinitely without a person and a deadline attached.
Then feed the answer back into the next cycle’s floors. A margin control system that never learns from settlement data will repeat every leak indefinitely.
Metrics That Prove Margin Held
These seven numbers tell you whether how to manage product discounts without losing profit margin was executed or merely intended.
|
Metric |
Formula |
Target |
|---|---|---|
|
Bundle CM rate vs blended benchmark |
Bundle CM% − weighted single-item CM% |
Positive, or funded gap explained |
|
Contribution per order, bundled vs unbundled |
CM₹ ÷ orders |
Bundled higher |
|
Incrementality rate |
Genuinely new orders ÷ bundle orders |
Above 20% |
|
Below-floor sale rate |
Units below floor ÷ total units |
Exactly zero |
|
Expected vs realised contribution |
Settlement CM ÷ modelled CM |
Above 95% |
|
Anchor SKU total units vs baseline |
All channels, bundled and unbundled |
Rising, not flat |
|
Stacked discount variance |
Realised discount − approved discount |
Within 2 points |
Targets other than the published incrementality threshold are operating benchmarks constructed for this article rather than industry standards.
Two rows carry the most weight. Incrementality above 20% is the published threshold at which a 15% bundle discount stops eroding contribution at typical AOV lift. Below-floor sale rate of exactly zero is the only metric here with no acceptable non-zero value; any breach means a control failed rather than a target was missed.
Getting How to Manage Product Discounts Without Losing Profit Margin Right Is a Control Problem
The commercial instinct behind bundles and discounts is usually sound. The failure is almost always in measurement and enforcement.
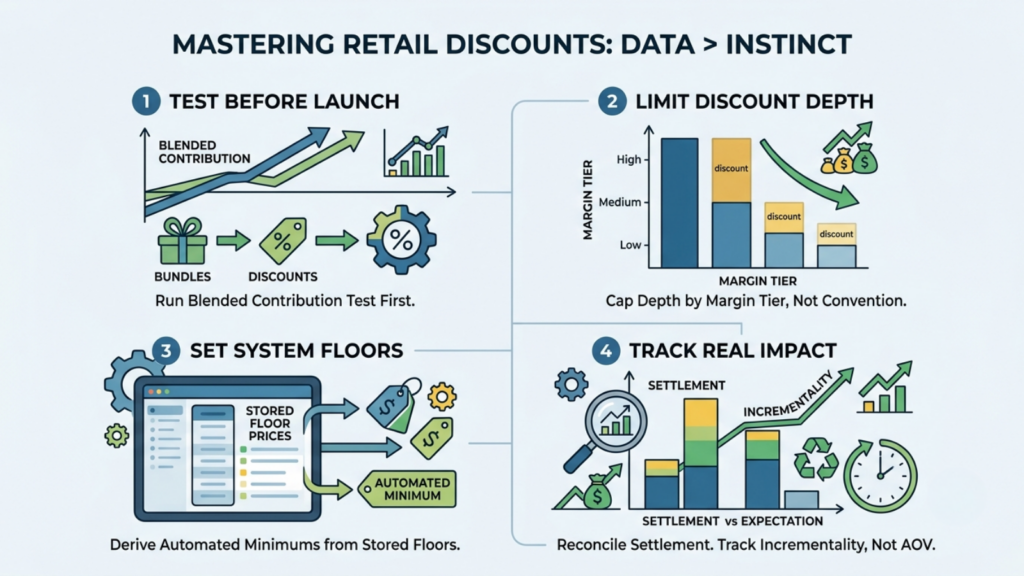
Run the blended contribution test before launching anything. Cap depth by margin tier rather than by category convention. Store floors in the system and derive every automated minimum from them. Model the stacked price, not your own. Track incrementality, not AOV. Reconcile settlement against expectation and feed the variance into next cycle.
With published data showing each discount point costing roughly 1.7 points of contribution, and median DTC contribution margin already compressed, the sellers who protect margin are not the ones discounting the least. They are the ones who knew the blended benchmark before the discount was set.
Test against the blend. Cap by tier. Enforce in the system. Reconcile every cycle.
Frequently Asked Questions
How deep can a bundle discount be before it destroys the margin?
Does a bundle that raises AOV always improve profit?
What is the most common way discounts erode margin without anyone noticing?
How does RTO change how to manage product discounts without losing profit margin in India?
Should discount limits be policy or system-enforced?