When a digital-first brand in India steps into physical stores, the first assumption is simple. Offline will reduce ad spends and increase scale. But the ground reality is very different. The unit economics of D2C offline retail expansion in India work on a completely different cost structure. Online CAC for many Indian beauty and food brands has increased by 70 to 120 percent in the last four years. Return rates in fashion and lifestyle can go up to 30 percent. Because of this pressure, founders see D2C offline retail as a safer bet.
However, most Indian sellers underestimate trade economics. In general trade, retailer margins range between 25 to 35 percent. Distributors take another 8 to 12 percent. Trade schemes add 5 to 10 percent. In modern trade like Reliance Retail, total channel deductions can touch 45 percent of MRP. This directly impacts retail margins D2C brands finally realize.
Another factor Indian brands often ignore is the credit cycle. Distributors typically operate on 30 to 45 days’ credit. Secondary sales move more slowly in Tier 2 and Tier 3 markets. Inventory holding can stretch to 60 days. Expiry returns in FMCG categories can reach 3 to 6 percent annually.
Still, with over 85 percent of India’s FMCG sales happening offline, D2C offline retail can unlock strong repeat demand if margins and working capital are tightly managed.
Understanding the Cost Structure and Unit Economics of D2C Offline Retail in India
Before entering D2C offline retail, Indian brands must clearly understand how revenue moves across the value chain. Unlike online channels, where brands may retain 65 to 80 percent gross margin after platform fees, offline distribution involves multiple intermediaries. This directly impacts retail margins, D2C brands finally realize.
| Component | Percentage Range |
|---|---|
| Distributor Margin | 8 to 15 percent |
| Super Stockist | 5 to 8 percent |
| Retailer Margin | 25 to 40 percent |
| Trade Schemes | 5 to 10 percent |
| Net Realization to Brand | 35 to 55 percent |
Now, let us break down the five key components of the unit economics of D2C offline retail expansion.
Net Realization Per Unit
 Formula: Net Realization = MRP − (Retailer Margin + Distributor Margin + Schemes + Freight)
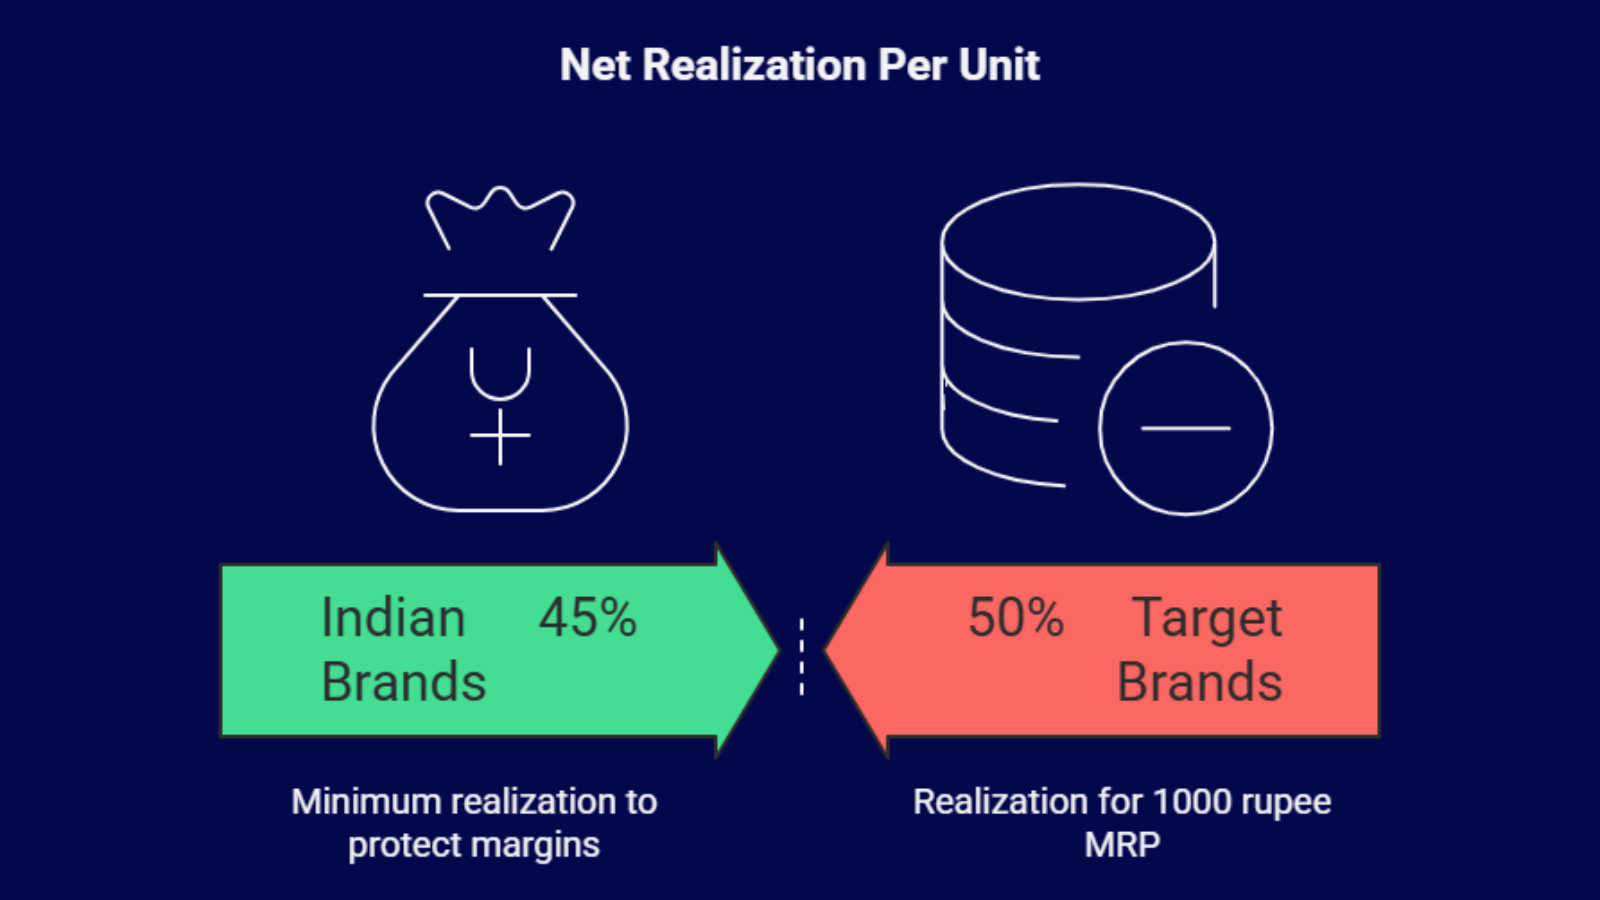
Example: For a 1000 rupee MRP, if total trade deductions are 50 percent, realization is 500 rupees. This amount must cover manufacturing costs and operating overheads. Indian brands should target a minimum of 45 percent realization to protect retail margins that D2C models depend on.
Sales Force and Distribution Cost
Formula: Sales Overhead % = Total Sales Team Cost ÷ Offline Revenue × 100
If the monthly offline revenue is 50 lakh and sales overhead is 6 lakh, the cost is 12 percent. Many Indian sellers underestimate this recurring expense in D2C offline retail.
Working Capital Lock-In
Formula: Working Capital Days = Inventory Days + Receivable Days − Payable Days
If the inventory cycle is 60 days and distributor credit is 30 days, effective capital lock-in becomes high, weakening the unit economics of D2C offline retail expansion.
Trade Marketing Investment
Formula: Trade Spend % = Trade Marketing Cost ÷ Offline Revenue × 100
If brands spend 8 lakh on visibility and 40 lakh on revenue, that equals 20 percent. This directly impacts retail margins D2C projections.
Expiry and Returns Risk
 Formula: Expiry Loss % = Expired Stock Value ÷ Total Billing × 100
In Indian FMCG, this can range from 3 to 6 percent annually, silently reducing profitability in D2C offline retail.
Channel Options in D2C Offline Retail
Not all D2C offline retail channels operate in the same way. In India, the choice between general trade, modern trade, and exclusive brand outlets directly impacts retail margins D2C brands can retain and the overall unit economics of D2C offline retail expansion. Each channel has a different cost structure, control level, and working capital requirement.
Below is a structured comparison:
| Factor | General Trade | Modern Trade | Exclusive Brand Outlets |
|---|---|---|---|
| Store Type | Kirana stores, small independent outlets | Large supermarket chains like Reliance Retail, DMart, Spencer’s | Brand-owned physical stores |
| Retailer Margin | 25 to 35 percent | 20 to 35 percent plus backend margins | Not applicable, brand retains retail margin |
| Distributor Involvement | High | Moderate to high | Usually low or direct supply |
| Listing Fees | Minimal or none | High listing and onboarding fees | No listing fees |
| Trade Schemes | Frequent and volume-driven | Structured promotional cycles | Controlled internally |
| Gross Margin Retention | Moderate | Lower due to trade spends | Highest among all channels |
| Rental Cost | Not applicable | Not applicable | High fixed rental and staff cost |
| Visibility | Moderate | Strong in-store visibility | Full brand control |
| Working Capital | High due to wide distribution | Moderate | High due to store setup and inventory |
| Scale Potential | Very high across Tier 2 and Tier 3 markets | High in urban markets | Limited but premium positioning |
In India, general trade drives over 80 percent of FMCG sales volume, making it critical for scale in D2C offline retail. Modern trade improves brand visibility but reduces retail margins D2C brands retain due to higher trade investments. Exclusive brand outlets offer better gross margin control but require strong footfall and higher upfront capital, impacting the unit economics of D2C offline retail expansion differently.
Pricing, Sales Costs, and Online vs Offline Economics for Indian D2C Brands
Pricing mistakes in D2C offline retail can permanently damage retail margins D2C brands work hard to build online. In India, many founders make the mistake of taking their online MRP and simply offering distributor margins on top of it. That rarely works. Pricing in offline must start from target net realization, not from competitor price comparison.
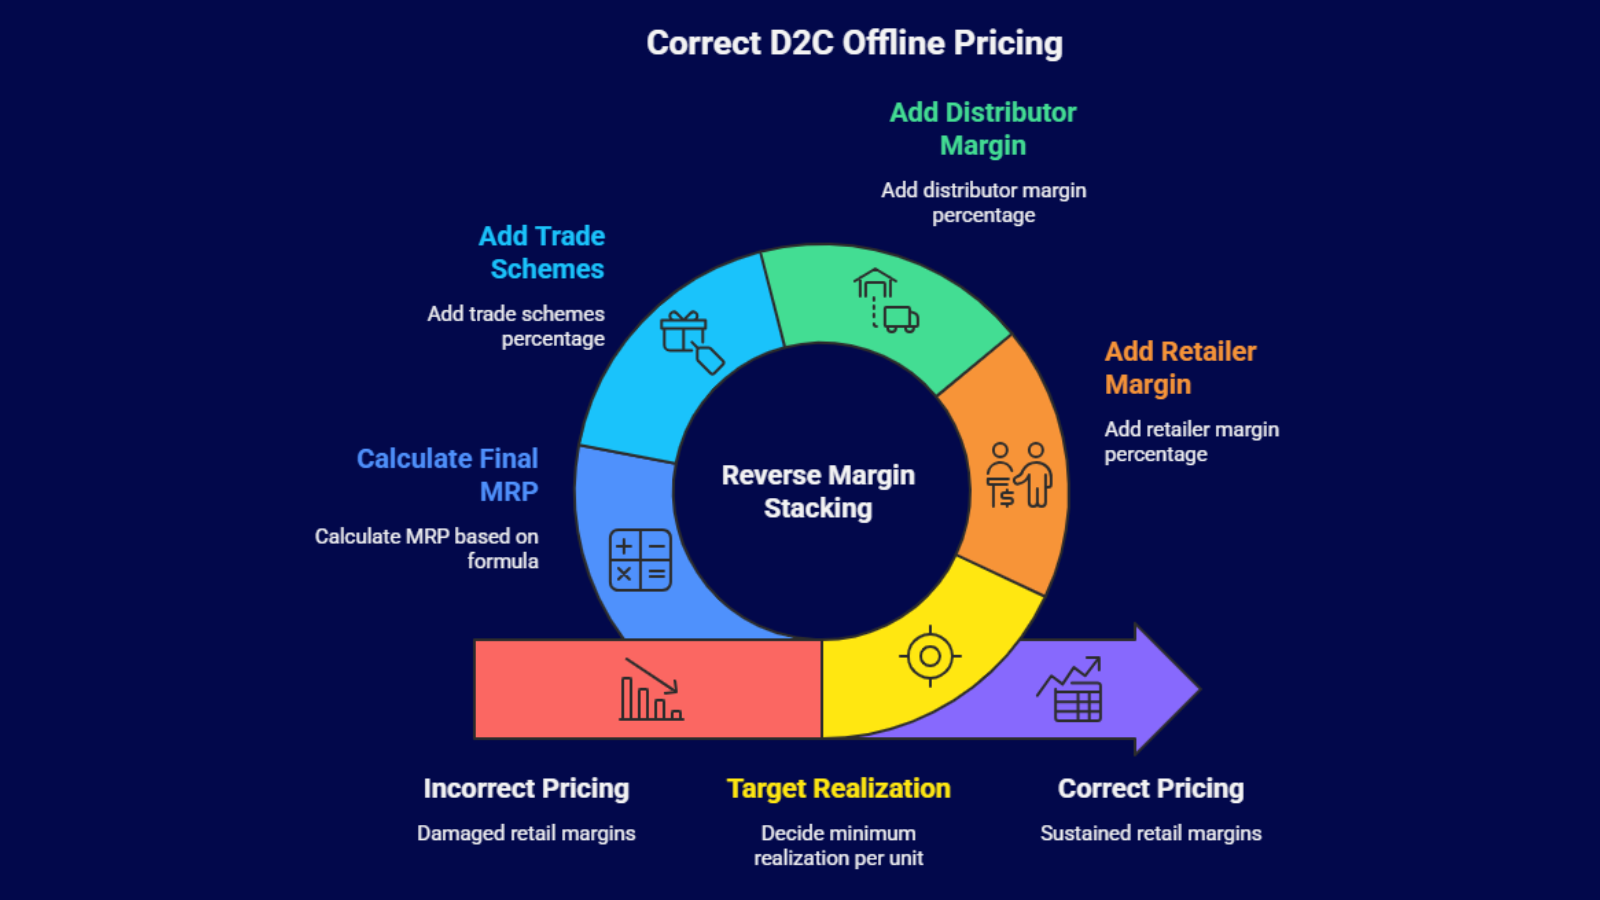 The correct approach is reverse margin stacking. First, decide the minimum realization your brand needs per unit. For most Indian FMCG and personal care brands, this should be at least 45 percent of MRP to sustain operations. Then add retailer margin, which in general trade ranges from 25 to 35 percent. Add distributor margin of 8 to 12 percent. Add trade schemes of 5 to 10 percent. Only after this should you calculate the final MRP. Formula:
MRP = Target Realization ÷ (1 − Total Trade Margin %)
For example, if you want 450 rupees realization and total trade margin is 50 percent, MRP must be 900 rupees. Many Indian sellers do not realize that modern trade chains often negotiate backend margins and annual rebates separately, which can increase effective trade deductions by another 3 to 5 percent.
Offline also introduces fixed sales costs that online brands often ignore. Area sales managers typically earn 6 to 12 lakh annually. Territory sales officers may cost 3 to 5 lakh per year each. Merchandisers and promoter salaries add further cost. Distributor incentives, typically 1 to 3 percent of billing, are needed to push secondary sales. Altogether, sales overhead usually ranges between 8 to 15 percent of offline revenue. This must be included in the unit economics of D2C offline retail expansion.
Now compare economics clearly:
| Factor | Online | D2C Offline Retail |
|---|---|---|
| Gross Margin | 60 to 80 percent | 35 to 55 percent |
| CAC | High and rising | Lower over time |
| Working Capital | Lower | Higher due to inventory spread |
| Returns | 10 to 25 percent | 2 to 5 percent |
| Control | High | Medium |
In India, over 85 percent of FMCG sales still happen offline. While margins look thinner in D2C offline retail, brands gain stronger brand trust, deeper penetration in Tier 2 and Tier 3 cities, and lower long-term acquisition costs. When pricing discipline and sales overhead control are maintained, the unit economics of D2C offline retail expansion can significantly improve blended profitability across channels.
Common Mistakes and How Indian Brands Can Build a Profitable D2C Offline Retail Model
 Many Indian brands enter D2C offline retail with strong online confidence but weak offline discipline. The result is fast billing growth but poor cash flow and shrinking retail margins D2C founders did not anticipate. The unit economics of D2C offline retail expansion only works when operational control is tighter than online.
Here are five common mistakes Indian sellers make and how to solve them:
Expanding Too Fast Without Sell-Through Proof
Many brands enter 300 to 500 stores within three months based only on distributor orders. Billing is not equal to demand. Solution: Pilot in 2 cities and track secondary sales weekly. If store-level sell-through is below 60 percent in 30 days, expansion should pause. Without this discipline, inventory returns increase and retail margins D2C brands expect start collapsing.
Ignoring Secondary Sales Data
Indian distributors often push stock to retailers to hit primary targets, but off-take may remain weak. Many founders do not audit retailer shelves. Solution: Track secondary sales ratio. Formula: Secondary Sales ÷ Primary Billing. Healthy ratio should be above 75 percent monthly to protect the unit economics of D2C offline retail expansion.
Underestimating Trade Schemes Escalation
In competitive categories like snacks and personal care, schemes can increase from 5 percent to 12 percent during festive or discount seasons. Many brands do not pre-budget this. Solution: Build a scheme buffer of 8 to 10 percent in pricing models from day one.
Weak Distributor Negotiation
Indian sellers often agree to 45-day credit without calculating working capital cost. Solution: Negotiate 21 to 30 day credit cycles and link distributor incentives to secondary movement, not billing volume.
Ignoring Working Capital Stress
Inventory in Tier 2 and Tier 3 markets can move slower than metro cities. Stock rotation may stretch to 75 days. Solution: Monitor inventory days monthly and cap distributor stock at 30 days of forward demand.
Offline expansion makes sense only when online revenue is stable, repeat purchase rate exceeds 30 percent, and gross margin is above 65 percent. When brands treat D2C offline retail as a financial system instead of a visibility play, the unit economics of D2C offline retail expansion becomes sustainable and predictable.
Final Thoughts
 Offline retail is not just another sales channel. It runs on a completely different cost structure, working capital cycle, and margin logic. The brands that succeed in D2C offline retail are the ones that understand store-level profitability, contribution margin per square foot, and inventory rotation speed. If your unit economics of D2C offline retail expansion are not clearly defined before launch, even strong online brands can struggle within 12 to 18 months.
This is where structured commerce infrastructure becomes critical. Offline adds complexity across pricing, stock allocation, returns, and taxation. Without central control, brands lose visibility on margins store by store.
Base.com works closely with D2C brands that are moving into physical retail and helps them build this control layer before expansion. For example, brands expanding into tier 2 cities use Base.com to track real-time inventory across warehouses and stores, preventing overselling and dead stock. Others use it to maintain pricing consistency across websites, marketplaces, and retail counters, protecting brand positioning and margins.
Base.com also enables centralized reporting on store performance, repeat purchase behaviour, and channel-wise profitability. Instead of guessing whether offline expansion is working, founders see clear unit-level data.
If you are planning your next phase of D2C offline retail growth, Base.com ensures your inventory, pricing, and operations stay aligned, so your expansion strengthens margins instead of weakening them.
FAQs
1. What is the average retailer margin in D2C offline retail?
Retailer margins usually range between 25 to 40 percent, depending onthe category. Premium categories may offer slightly lower margins. These margins directly impact retail margins D2C brands can retain after trade deductions.
2. How much working capital is needed for offline expansion?
Brands should plan for at least 3 to 6 months of inventory coverage. Working capital depends on distributor credit terms and stock rotation speed within D2C offline retail channels.
3. Is offline retail more profitable than online for D2C brands?
Not immediately. Online shows higher gross margins. However, strong unit economics of D2C offline retail expansion can improve blended profitability over time through repeat purchases and lower CAC.
4. What is the biggest risk in D2C offline retail?
Inventory blockage is the biggest risk. Slow sell-through increases working capital pressure and reduces effective retail margins D2C brands depend on for sustainable growth.
5. Should early-stage brands enter offline retail?
Only if gross margins exceed 65 percent and repeat demand is proven. Without strong product-market fit, the unit economics of D2C offline retail expansion may not justify the investment.