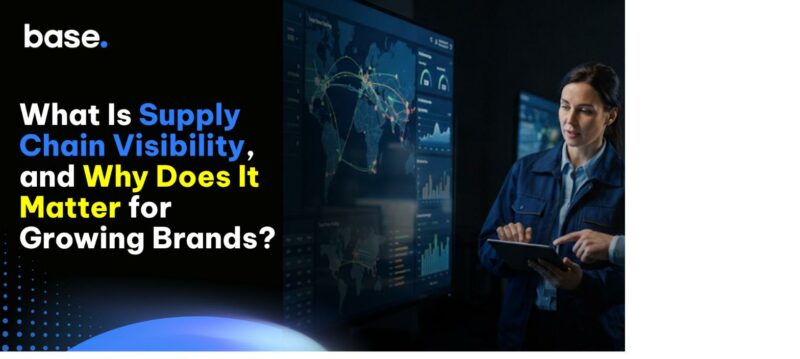
Supply chain visibility for D2C brands means having real-time, accurate insight into every stage of a product’s journey, from supplier and warehouse stock through to delivery and returns.
Only about 6% of organizations report full end-to-end supply chain visibility, and 80% experienced at least one supply chain disruption in 2024 alone.
AI-enabled supply chains deliver 65% higher service levels compared to those running on fragmented, manual data. India’s D2C sector is growing at roughly 40% CAGR, and the global D2C market is projected to reach $319.57 billion in 2026, which means the gap between brands with strong supply chain visibility for D2C brands and those without it is only going to widen as competition intensifies.
What Is Supply Chain Visibility
Supply chain visibility is the ability to track and access accurate data about inventory, orders, suppliers, and shipments across every stage of the fulfillment process, in real time rather than through periodic manual checks. For growing brands, supply chain visibility for D2C brands specifically means connecting supplier lead times, warehouse stock, order status, and delivery data into one system, rather than checking five disconnected tools to answer one question.
The supply chain visibility software market alone is valued at $3.3 billion in 2025 and projected to grow to $10.9 billion by 2034, reflecting how central this capability has become to modern commerce operations, not just enterprise manufacturing.
It is worth being precise about what supply chain visibility for D2C brands is not. It is not a single reporting dashboard reviewed once a week, and it is not the same thing as having a WMS or an OMS installed. A brand can own several individual systems and still lack real visibility if those systems do not share data with each other in real time. True visibility means the data updates continuously and is accessible to every team that needs it, not just the team that owns the underlying software.
Why Supply Chain Visibility Matters for Growing D2C Brands
Supply chain visibility for D2C brands is not an operational nice-to-have once a brand crosses a certain order volume. It becomes the difference between scaling smoothly and scaling into chaos, since every downstream process, from fulfillment to customer trust, depends on it directly.
The DTC customer acquisition cost has risen 222% over the past eight years, which means every customer a brand acquires is more expensive to replace than ever before. Poor supply chain visibility for D2C brands directly threatens retention, since a stockout or a mishandled return can undo months of paid acquisition spent in a single bad experience.
1. Revenue Impact

Stockouts and overselling caused by poor visibility directly cost sales rather than merely damaging customer goodwill. When a brand does not know its true stock position across warehouses and channels, it either turns away a sale it could have fulfilled or confirms an order it cannot actually deliver, and both outcomes carry a direct revenue cost.
A good fill rate sits between 85% and 95%, and businesses without real-time visibility rarely get close to that range, because their reorder decisions and stock allocation are based on delayed or incomplete data. The gap between an 80% fill rate and a 95% fill rate compounds every single day, since every unfulfilled order is a sale that simply does not happen rather than one that is merely delayed.
Return rates in Indian ecommerce run 25-40% depending on category, and poor visibility upstream is a common hidden cause, since dispatch errors, address mismatches, and stock misallocation often trace back to a brand not having an accurate real-time picture of its own operations. Fashion and apparel return processing alone can cost 20-65% of an item’s value once reverse logistics, inspection, and restocking are factored in, which means visibility gaps in this category carry an outsized financial cost compared to categories with lower return rates.
2. Customer Trust Impact
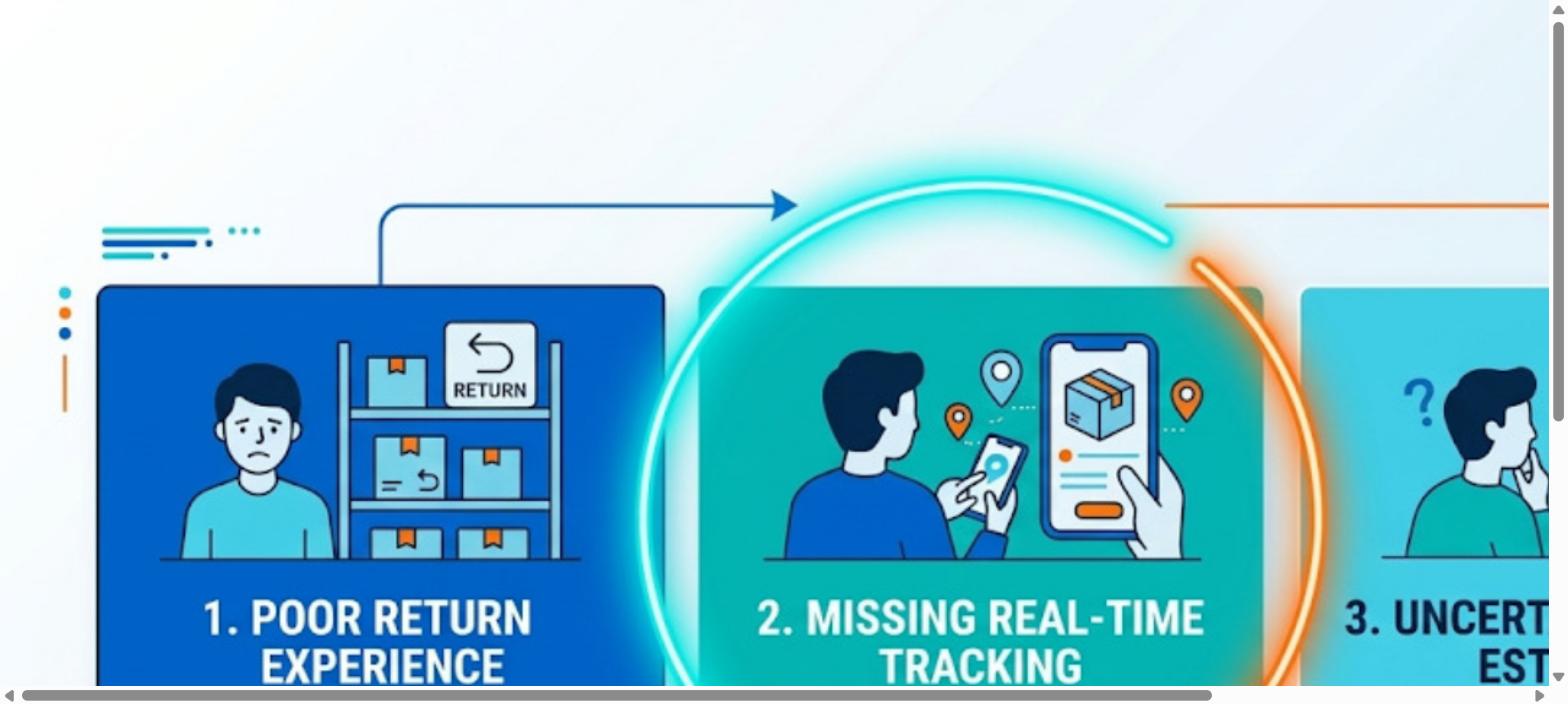
67% of customers avoid future purchases from a brand after a poor return experience, which makes visibility a retention issue as much as an operational one. A brand that cannot process a return quickly or communicate accurately about it is quietly losing repeat customers without ever seeing the cause show up in a single dramatic metric.
Customers increasingly expect real-time order tracking as a baseline rather than a premium feature, shaped heavily by the standards set by quick commerce platforms and large marketplaces. A brand offering vague or outdated tracking information looks behind the curve even if its actual delivery performance is reasonably strong, since the perception gap itself damages trust.
Delayed or inaccurate delivery estimates are also a leading driver of cart abandonment before a purchase is even completed, since customers weigh delivery certainty almost as heavily as price when deciding whether to complete checkout. Poor supply chain visibility for D2C brands shows up here before an order is even placed, not just after.
3. Operational Efficiency Impact
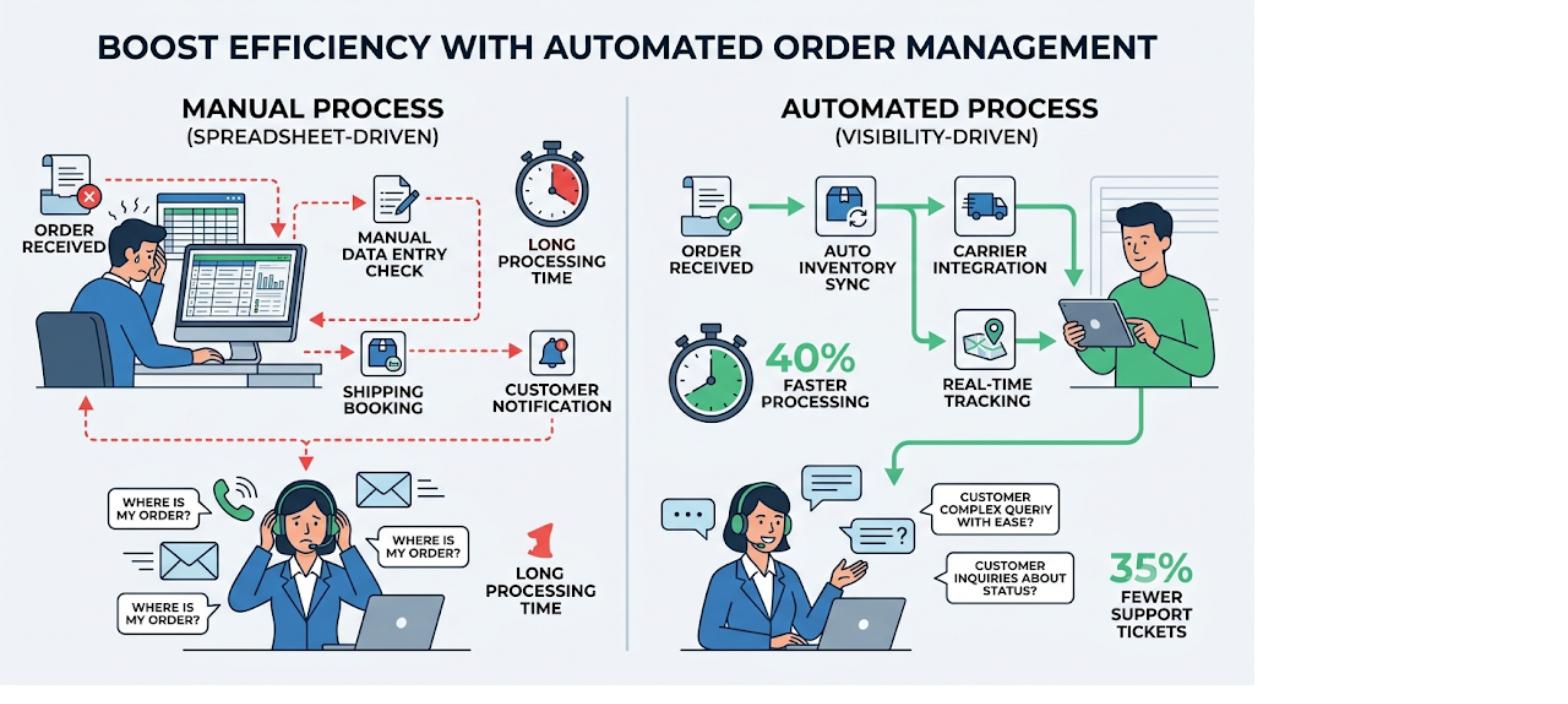
Automated, visibility-driven order management cuts processing time by roughly 40% compared to manual, spreadsheet-driven workflows, since orders move through validated, connected systems instead of requiring manual checks at every stage. These time-saving compounds as order volume grows, which is exactly when manual processes start to break down most visibly.
Businesses with proper real-time tracking reduce “where is my order” support tickets by around 35%, freeing customer service teams to handle genuinely complex issues instead of repetitive status lookups. This is one of the more underappreciated efficiency gains from strong supply chain visibility for D2C brands, since it shows up as a headcount and morale benefit rather than a directly measurable revenue line.
Manual reconciliation between systems that lack shared visibility routinely takes days instead of hours, particularly when stock, order, and financial data live in separate tools that were never designed to sync with each other. This reconciliation burden falls disproportionately on operations and finance teams, and it tends to get worse, not better, as a brand adds warehouses or sales channels without addressing the underlying visibility gap.
The Five Layers of Supply Chain Visibility for D2C Brands
Supply chain visibility for D2C brands is not one single dashboard. It is built from five distinct layers, each of which needs to be accurate and connected for the whole system to function reliably.
Treating any one layer in isolation is a common mistake. A brand with excellent inventory visibility but no supplier visibility can still get blindsided by a stockout because the warehouse data was accurate right up until the supplier failed to deliver on time. Supply chain visibility for D2C brands only delivers its full value when all five layers are connected to each other.
1. Inventory Visibility
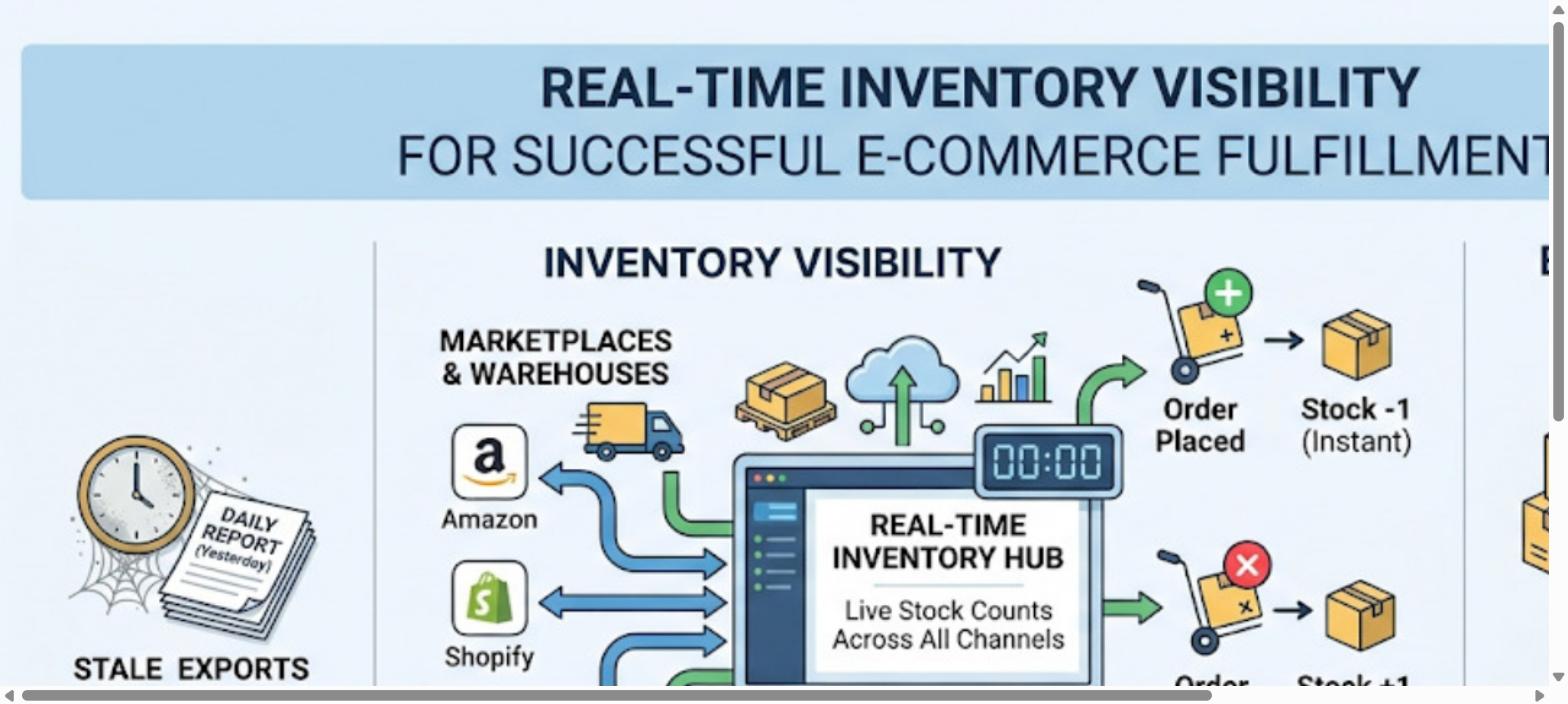
Inventory visibility means real-time stock counts across every warehouse and marketplace, updated the moment an order is placed, cancelled, or returned, rather than a daily or weekly export that is already stale by the time anyone looks at it.
Without this, a brand risks confirming a sale on one channel for stock that has already been committed on another, which is one of the fastest ways poor visibility turns directly into lost revenue and customer frustration.
For any product with a shelf life, batch and expiry tracking is a critical extension of inventory visibility, and this matters especially for FMCG and pharma-adjacent D2C categories where expired stock effectively disappears from usable inventory without ever showing up as a clean stockout.
A brand selling supplements, skincare, or food products needs this layer working correctly, or it will quietly write off inventory value it never even knew was at risk.
2. Order Visibility
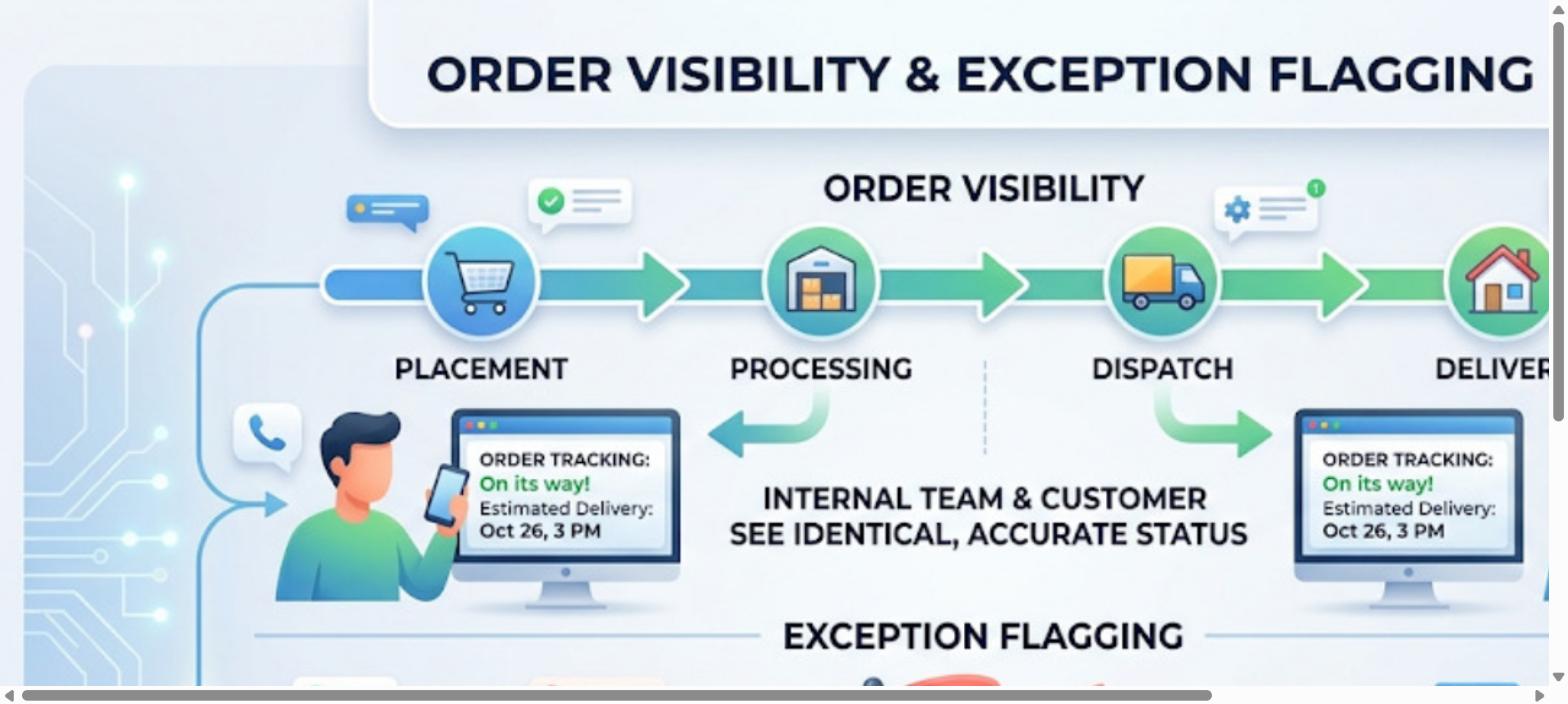
Order visibility means live order status from placement through dispatch, visible to both internal teams and customers at the same time, rather than internal teams knowing more than customers or vice versa. When this layer works correctly, a customer service agent and a customer looking at a tracking page see identical, accurate information, which removes an entire category of avoidable support friction.
Exception flagging is the other half of order visibility, catching delayed, cancelled, or high-risk orders before they escalate into customer complaints. A brand with strong order visibility notices a stuck order within hours, while a brand without it often only finds out when a frustrated customer reaches out directly, by which point the goodwill damage has already been done.
3. Supplier Visibility
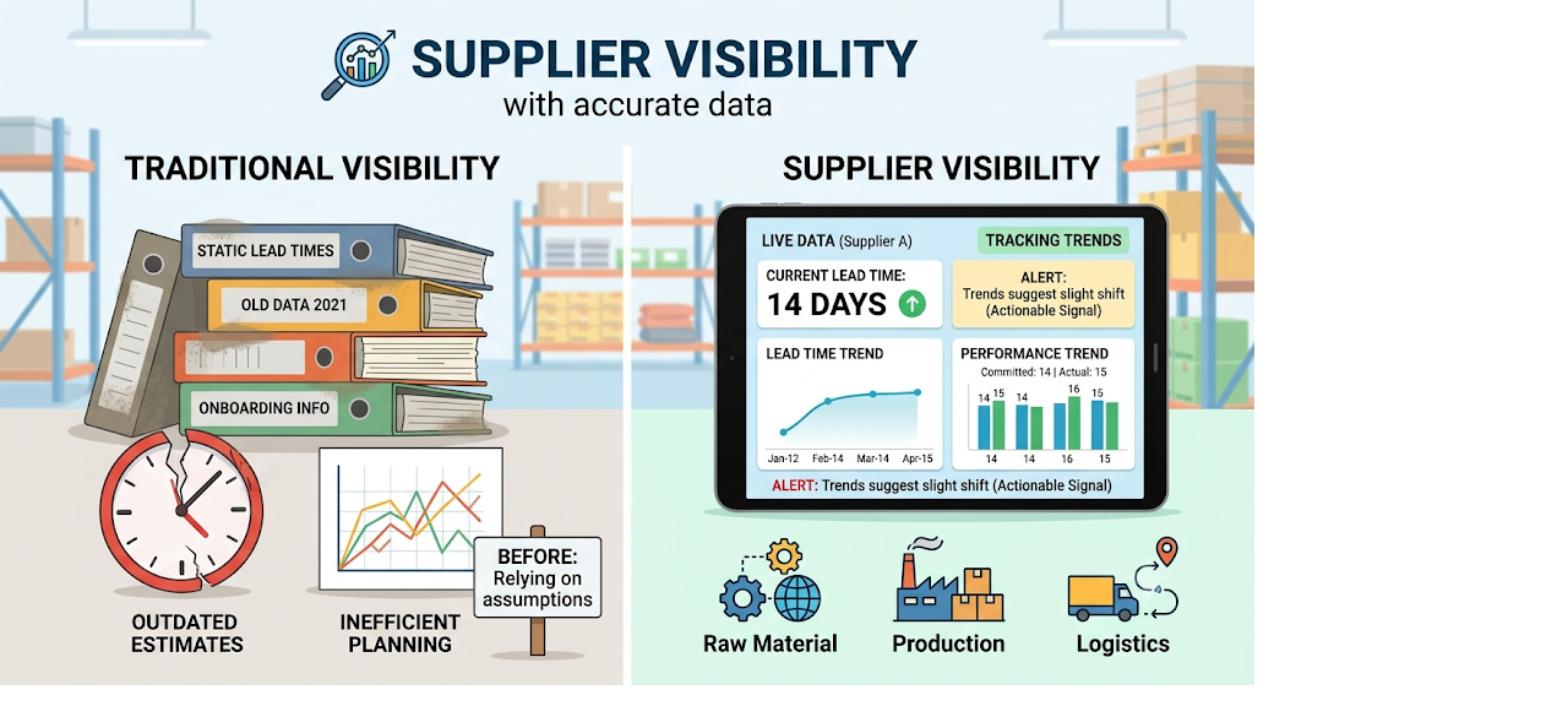
Supplier visibility means having accurate, current lead time data per supplier, rather than a static number set once at onboarding and never revisited. Supplier lead times shift for all kinds of reasons: raw material availability, seasonal demand on the supplier’s own production line, logistics disruptions, and a brand relying on outdated assumptions is essentially planning inventory on false information.
Just as important is visibility into supplier performance trends over time, so delays get caught as an emerging pattern before they actually cause a stockout. A supplier that has been trending 3-4 days later than committed for two months running is a signal worth acting on well before that trend produces an empty shelf, and this kind of pattern recognition is exactly what supplier visibility is meant to catch.
4. Logistics Visibility
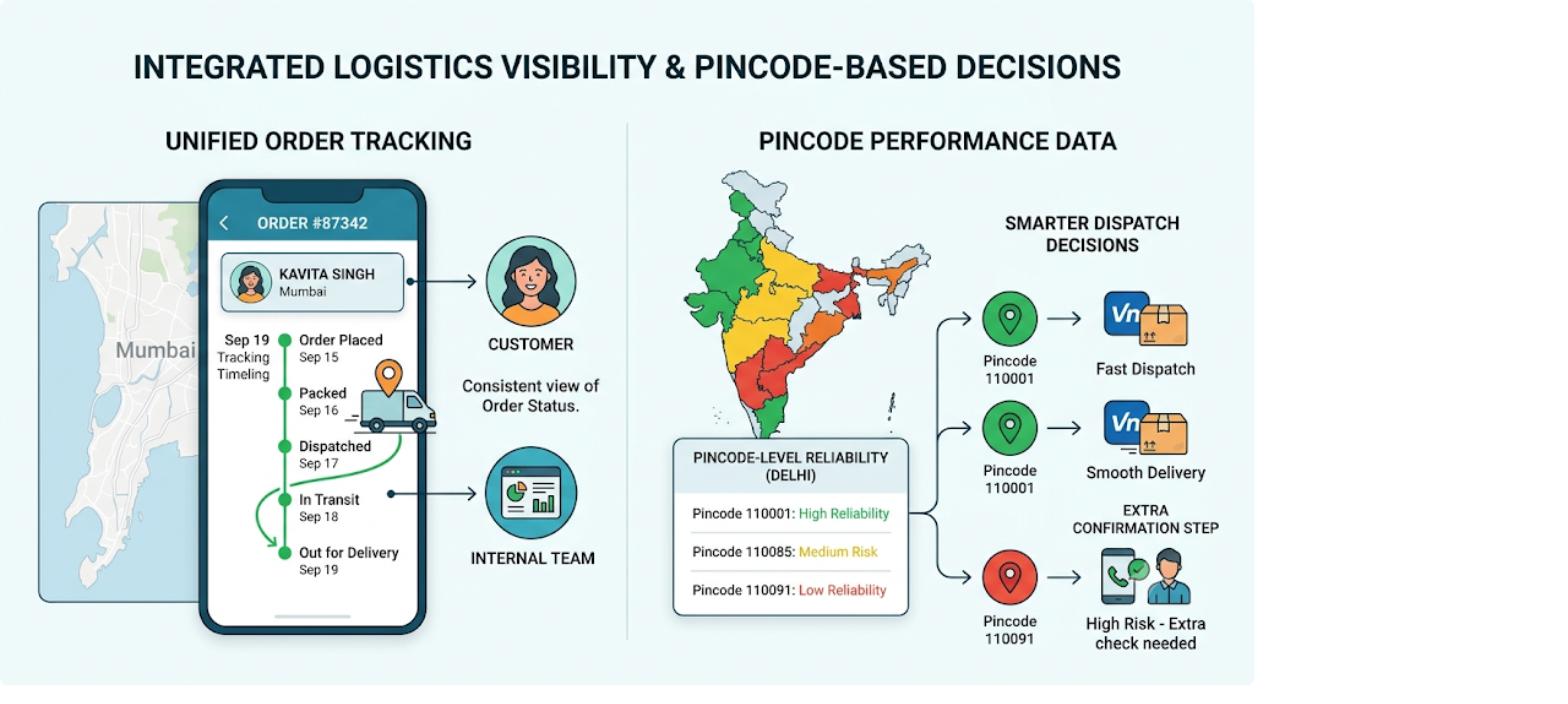
Logistics visibility means real-time courier and shipment tracking integrated directly into the order record, rather than tracking information that lives separately in a courier partner’s own portal disconnected from the rest of the order lifecycle. This integration is what makes it possible to give customers and internal teams one consistent view of where an order actually stands.
Pincode-level delivery performance data is a particularly valuable extension of this layer for Indian sellers, since delivery reliability varies significantly by location. Using this data to inform dispatch decisions and COD risk scoring lets a brand make smarter choices about which orders need extra confirmation steps before they ship, rather than treating every order the same regardless of known delivery risk in that specific pincode.
5. Financial Visibility
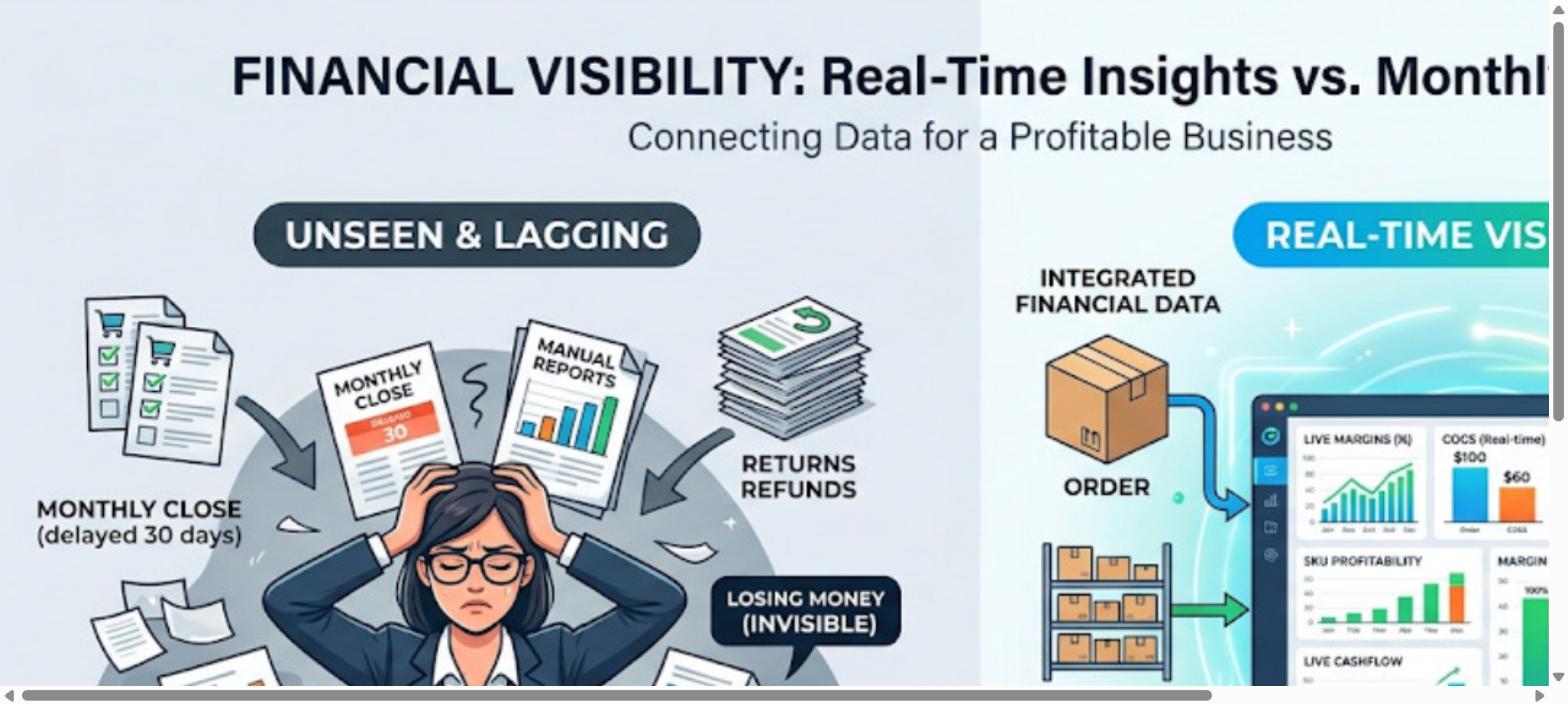
Financial visibility means real-time cost of goods sold and margin data tied directly to actual order and inventory movement, rather than a monthly finance close that reconstructs the picture well after the fact. Without this, a brand can look operationally healthy while quietly losing money on specific SKUs or channels, since the financial reality is invisible until someone manually pulls it together.
Return and refund data needs to connect to financial reporting directly as well, rather than being reconciled separately at month-end. A brand that treats returns as a logistics problem alone, without linking that data to margin analysis, will consistently underestimate how much a high-return category or SKU is actually costing the business.
The Real Cost of Poor Supply Chain Visibility
Brands often underestimate the cost of weak supply chain visibility for D2C brands because the losses rarely show up as one dramatic event. They show up as a slow accumulation of small inefficiencies that quietly erode margin every month.
80% of organizations experienced at least one supply chain disruption in 2024, and brands with strong visibility recover from these disruptions in hours, while those without it often do not notice until a customer complaint or a stockout forces the issue. That delay between when a problem occurs and when a brand actually notices it is the single most expensive gap that poor supply chain visibility for D2C brands creates.
Signs Your D2C Brand Lacks Supply Chain Visibility
Recognizing a visibility gap early is far cheaper than discovering it during a festive-season order spike. A brand is likely lacking sufficient supply chain visibility for D2C brands if several of the following feel familiar.

- Stock counts differ between your website and your marketplace listings at any given moment.
- Customer service cannot confirm order status without contacting the warehouse directly.
- Supplier delays are discovered only after a stockout has already occurred.
- Reconciling inventory with financial records takes days rather than hours.
- Return processing lags far behind the pace at which returns actually arrive.
- Festive season order spikes consistently cause dispatch delays and confusion.
- Nobody can say with confidence which SKUs are actually profitable right now.
- Reports on fulfillment performance are compiled manually rather than generated live.
Most growing D2C brands will recognize themselves in at least two or three of these signs at once, since the underlying causes tend to overlap. Weak inventory visibility, for instance, usually shows up simultaneously as stock mismatches, delayed support responses, and inaccurate profitability reporting, not as a single isolated symptom.
Key Analytics Every D2C Brand Needs for Supply Chain Visibility
Visibility without analytics is just a dashboard. The real value of supply chain visibility for D2C brands comes from the analytics layered on top of that visibility, since raw data only becomes useful once it informs a decision.
AI-enabled supply chains deliver 65% higher service levels compared to those running on fragmented, manual data, and that gap is driven almost entirely by the analytics layer, not the underlying data collection itself. Two brands can have identical data feeds and see very different results depending on whether that data actually gets translated into inventory, forecasting, and pricing decisions.
1. Inventory Analytics
Stock-to-sales ratio per SKU is one of the most immediately actionable inventory analytics, since it catches overstocking or understocking early, before either problem becomes expensive. A SKU with a rising stock-to-sales ratio is quietly tying up capital in slow-moving inventory, while one with a falling ratio may be heading toward a stockout that has not yet triggered an alert.
Days of inventory on hand is the natural companion metric, and it needs to be tracked per warehouse rather than as one blended company-wide number. A brand with three warehouses can look healthy on average while one specific location is dangerously low on a fast-moving SKU, and that nuance only shows up when the analytics are broken out by location rather than aggregated.
2. Demand and Sales Analytics
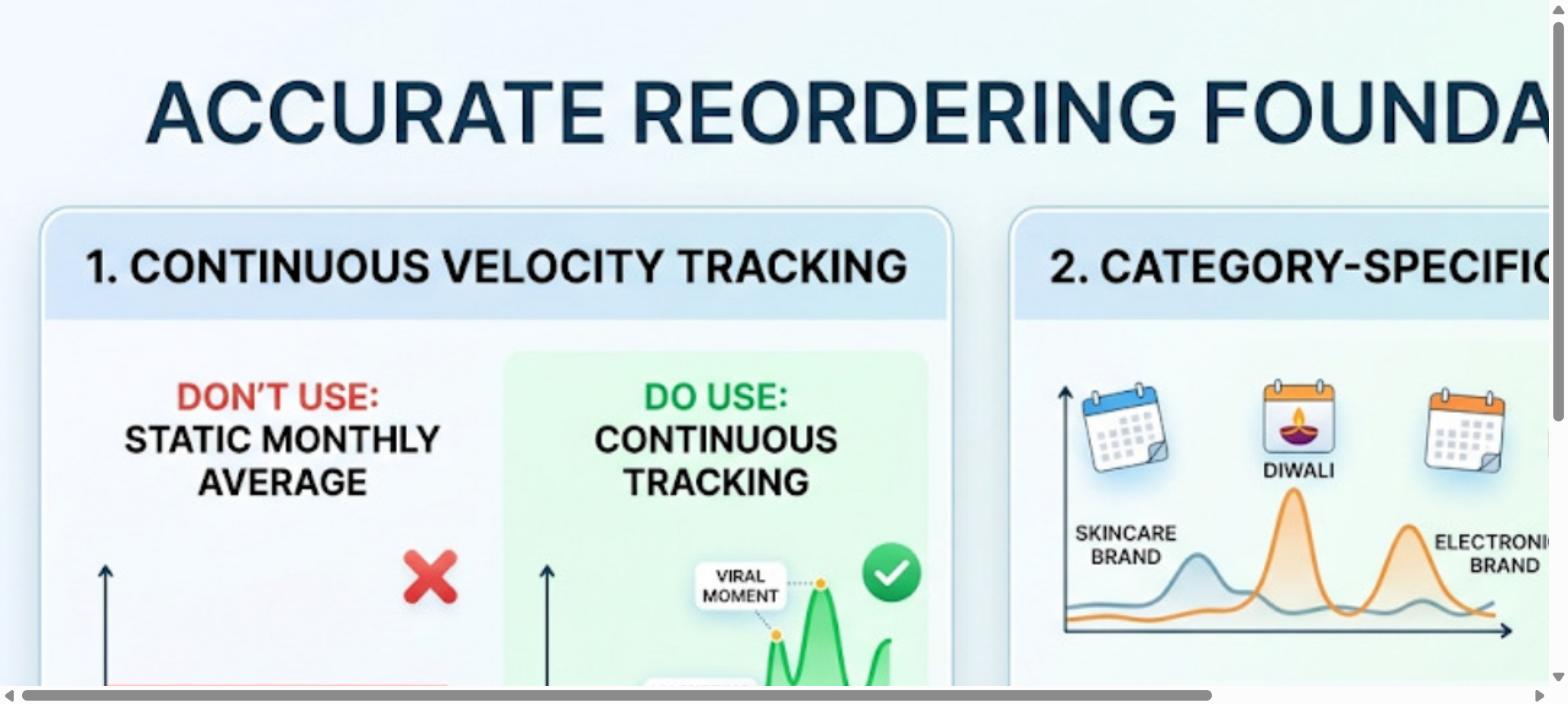
Order velocity per SKU, updated continuously rather than as a static monthly average, is the foundation of accurate reordering. A monthly average smooths over exactly the kind of sudden demand shifts, driven by a marketing push, a viral moment, or a price change, that a brand most needs to react to quickly, so continuous tracking matters more than the underlying math being sophisticated.
Seasonal and festive-period demand patterns specific to your own category matter more than generic industry benchmarks, since a skincare brand’s Diwali spike looks nothing like an electronics brand’s Republic Day spike. Building this analysis from a brand’s own historical order data, rather than borrowing a generic seasonality curve, is what makes demand forecasting genuinely useful rather than a rough approximation.
3. Fulfillment and Logistics Analytics
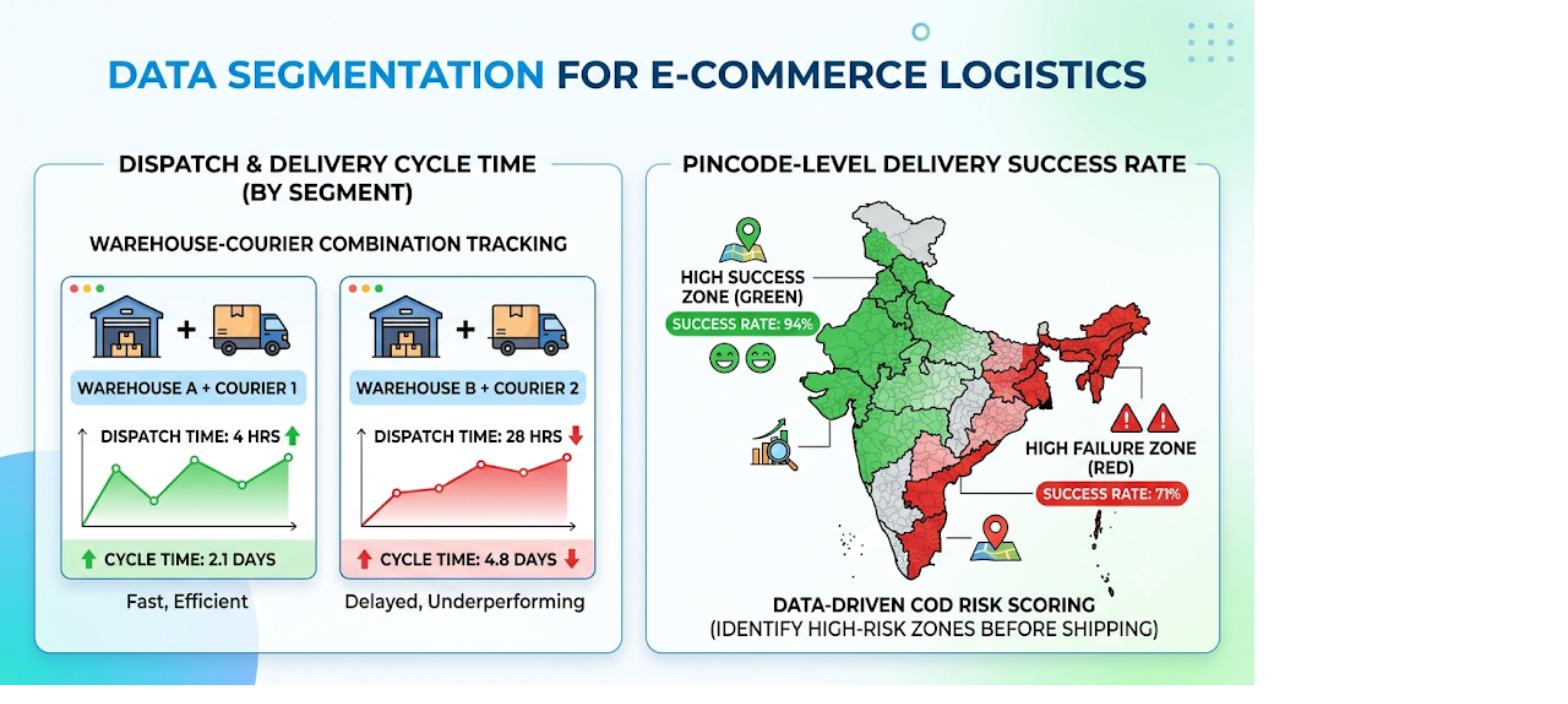
Dispatch time and order-to-delivery cycle time need to be tracked by warehouse and by courier partner, not as a single company-wide average that hides which specific combination is underperforming. A brand might have excellent average dispatch times overall while one warehouse-courier combination is consistently slow, and that detail only surfaces when the analytics are segmented properly.
Pincode-level delivery success and failure rates are the other essential piece of this analytics category, since they directly inform COD risk scoring before an order ships. A brand that tracks this data can identify high-risk delivery zones proactively and adjust its dispatch or payment confirmation process specifically for those areas, rather than applying the same policy uniformly across a country as geographically varied as India.
4. Returns Analytics
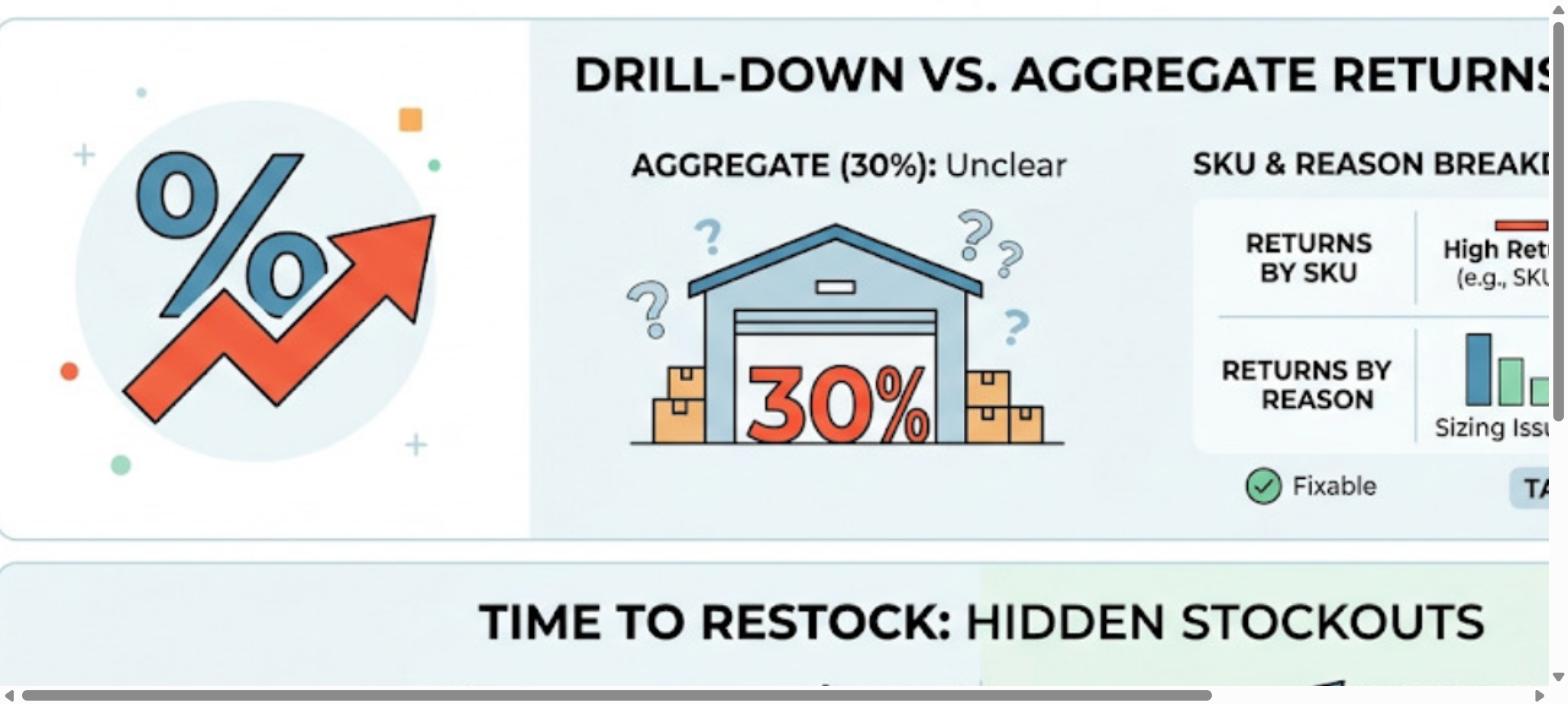
Return rate by SKU and by reason code tells a much richer story than a single aggregate return percentage, since a 30% aggregate return rate could mean every SKU returns moderately, or it could mean two specific SKUs are driving almost all of it. Only the SKU-level and reason-level breakdown reveals which product, sizing, or quality issue is actually responsible, which is the only version of this data a brand can act on directly.
Time from return receipt to restocking as sellable inventory is a quieter but equally important metric, since delays here directly reduce fill rate even though the stock technically exists. A returned item sitting unprocessed in a warehouse corner for two weeks is functionally the same as a stockout from a fill rate perspective, and this analytic is what catches that gap.
5. Supplier Analytics

On-time-in-full performance per supplier needs to be tracked as a formal, ongoing metric rather than an informal impression formed from memory of recent interactions. A supplier that delivered reliably a year ago may have quietly become less consistent, and without a tracked metric, that shift often goes unnoticed until it causes a stockout.
Lead time variability per supplier is the analytic that feeds directly into safety stock calculations, since a supplier with a highly variable lead time requires a larger buffer than one with a consistent, predictable lead time, even if their average lead times are identical. Treating all suppliers as equally predictable, without tracking this variability, is a common reason safety stock levels end up either too thin or unnecessarily large.
6. Financial and Margin Analytics
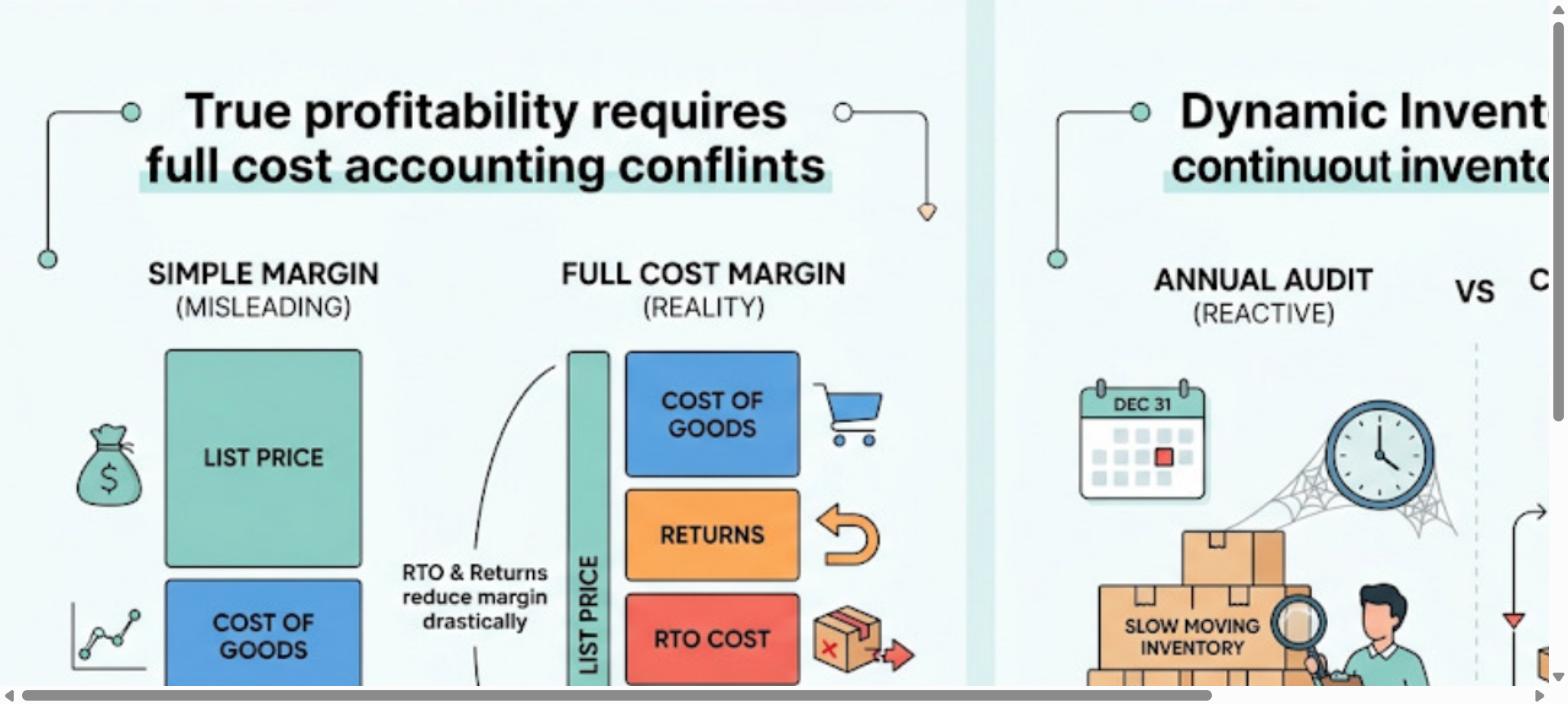
Contribution margin per SKU needs to factor in returns, RTO cost, and fulfillment cost, not just list price minus cost of goods, since that simpler calculation routinely overstates how profitable a high-return or high-RTO SKU actually is. A product that looks like a strong margin performer on paper can be a net loss once the full cost of its return rate and failed deliveries is accounted for properly.
Working capital tied up in slow-moving inventory should be tracked continuously rather than discovered during an annual audit, since capital trapped in dead stock has a real, ongoing opportunity cost every month it sits unsold. This analytic is what turns a vague sense that “we have too much of some things” into a specific, actionable number a brand can use to make purchasing and clearance decisions.
Together, these six analytics categories form the practical backbone of supply chain visibility for D2C brands, turning raw operational data into decisions about purchasing, pricing, and channel strategy.
How to Build Supply Chain Visibility for D2C Brands
Building real supply chain visibility for D2C brands is a sequence, not a single software purchase. Brands that try to do everything at once typically end up with a fragmented rollout that recreates the same visibility gaps in new tools.
The order below reflects which layers deliver the fastest return relative to implementation effort. Most brands see the clearest early wins from inventory and order visibility, since those two layers directly touch fill rate and dispatch speed, the metrics most closely tied to near-term revenue.
- Start with inventory visibility first, since every other layer depends on accurate, real-time stock data.
- Connect order data next, so stock movement and order status share the same source of truth.
- Layer in supplier visibility, particularly lead time and performance tracking, once internal data is reliable.
- Add logistics and courier-level visibility, especially pincode-level delivery performance for COD-heavy categories.
- Build financial visibility last, connecting margin and cost data to the operational layers already in place.
- Introduce analytics dashboards progressively, starting with the metrics tied most directly to revenue, like fill rate and RTO.
- Avoid running visibility initiatives through disconnected point solutions, since that recreates data silos under a different name.
- Revisit the entire system quarterly, since a visibility setup that worked at last year’s order volume may not hold at this year’s.
Skipping steps in this sequence is the most common reason brands end up disappointed with their supply chain visibility for D2C brands’ rollout. Financial visibility built on top of inaccurate inventory data, for example, just produces confident-looking numbers that are wrong, which is often worse than no visibility at all.
How Base.com Delivers Supply Chain Visibility for D2C Brands
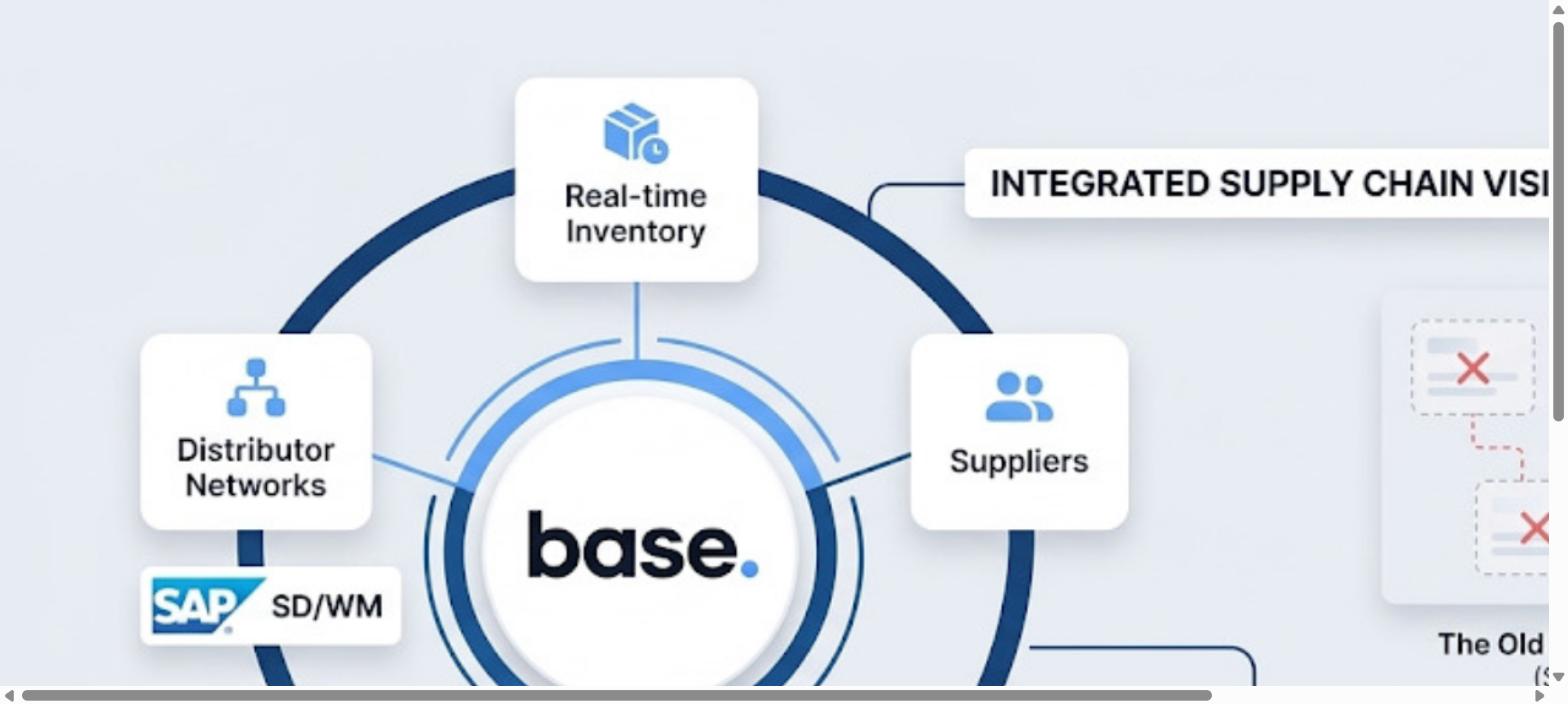
Base.com is built around exactly this layered approach to supply chain visibility for D2C brands, connecting real-time inventory, order execution, supplier, and courier data into one system rather than five disconnected tools. For FMCG and pharma-adjacent D2C brands specifically, this includes native SAP SD/WM and distributor ERP integration, so supply chain visibility for D2C brands extends across distributor networks, not just a brand’s own warehouses.
Base.com’s return-risk scoring, real-time reorder point calculation, and pincode-level courier data feed directly into the analytics categories covered above, so a brand does not need to stitch together inventory analytics, returns analytics, and logistics analytics from separate systems that were never designed to talk to each other.
Rather than treating supply chain visibility for D2C brands as a one-time implementation project, Base.com is designed to keep every layer current as a brand adds warehouses, suppliers, or sales channels, so visibility does not quietly degrade the way it does with a system set up once and never revisited.