

India’s cash-on-delivery return problem is not uniform across categories. Understanding COD return rates by category in India 2026 is the single most important diagnostic step for any Indian D2C brand losing margin to returns. Fashion returns 25-40% of COD orders. Electronics returns 10-15%. Beauty sits at 18-22%. If you are managing returns as a blended number, you are making inventory and fulfilment decisions on data that hides where your actual loss originates.
This report on COD return rates by category in India 2026 breaks down the numbers, the drivers, and what Indian sellers are doing operationally to reduce them.
Why COD Return Rates by Category in India 2026 Deserve a Dedicated Report
India’s ecommerce market is projected to reach $226 billion by 2026. COD remains the dominant payment method, accounting for 50-60% of total orders in tier 2 and tier 3 cities. Despite UPI growth, COD is not declining in absolute volume. It is the trust mechanism that brings first-time buyers into ecommerce in markets where credit card penetration is low, and digital payment confidence is still building.
The problem is not COD itself. The problem is that COD creates a zero-commitment order. A customer places an order with no financial skin in the game. When delivery arrives, acceptance is optional. At India’s scale, that optionality translates into a returns problem costing the industry thousands of crores annually.
Tracking COD return rates by category in India 2026 at the category level, not just as a blended number, is what separates brands that are managing this cost from brands that are absorbing it.
Top 20 COD Return Rate Statistics for India 2026, In Detail
India’s COD-driven ecommerce landscape continues to face high return rates, making RTO a critical operational and profitability challenge for D2C brands.
1. India’s Overall E-commerce Return Rate is 25-30%
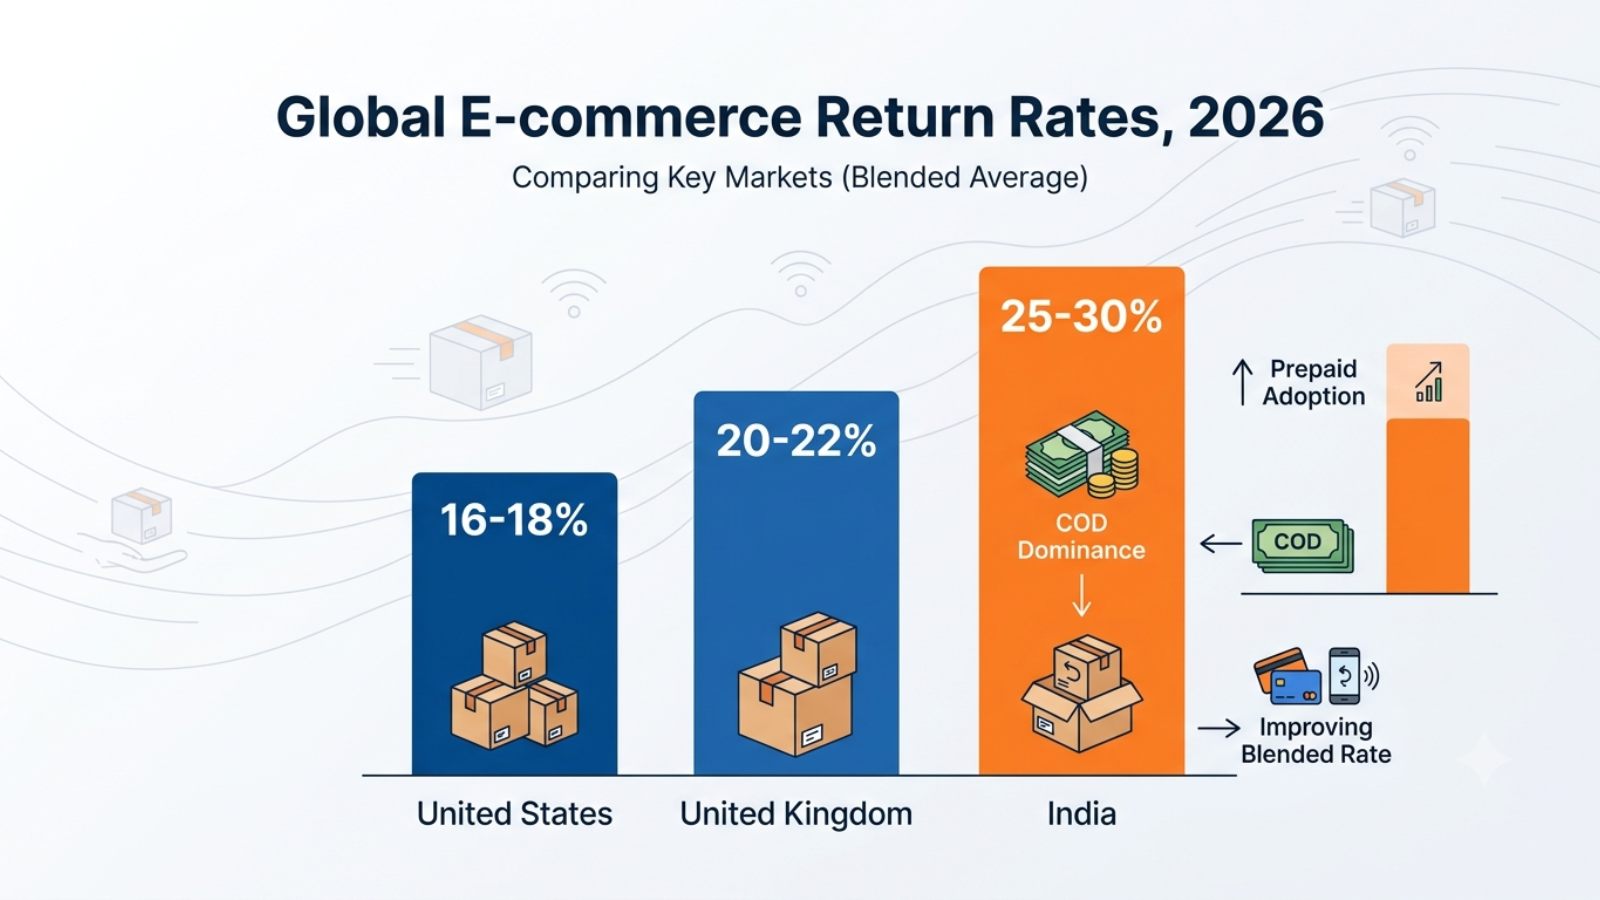 India’s blended ecommerce return rate across all categories and payment methods sits at 25-30% in 2026, one of the highest globally among major ecommerce markets. For context, the US ecommerce return rate averages 16-18% and the UK averages 20-22%.
India’s higher number is structurally driven by COD dominance, not product quality. As prepaid adoption grows, this blended number will improve, but the COD-specific rate will remain elevated regardless.
Any honest analysis of COD return rates by category in India 2026 must start with this baseline: India is a high-return market, and COD is the primary driver.
2. COD Orders Return at 1.8-2.3x the Rate of Prepaid Orders
 Across every measured product category, COD orders return at 1.8-2.3 times the rate of prepaid orders for identical SKUs on identical platforms.
This is the most important single data point in any COD return rates by category in India 2026 analysis. It confirms that payment method, not product quality, not listing accuracy, not logistics performance, is the strongest predictor of whether an order will be returned.
A brand that converts 20% of its COD volume to prepaid does not just save on those specific orders. It shifts its entire return rate profile toward the lower prepaid benchmark.
3. Fashion and Apparel COD Return Rate: 25-40%
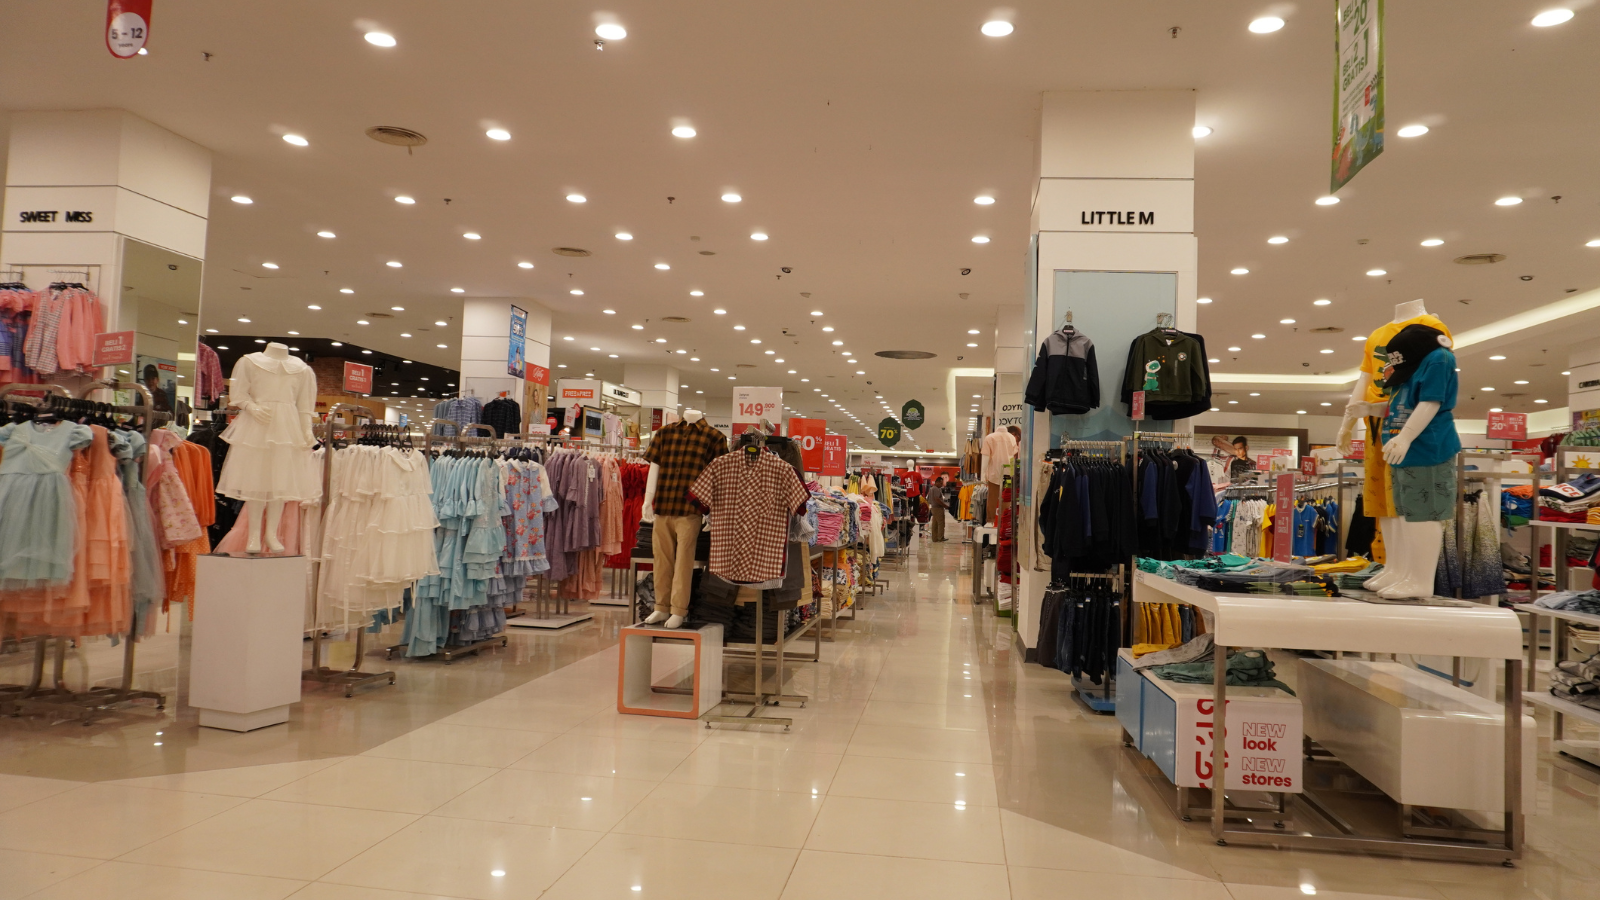 Fashion leads all categories in COD return rates by category in India 2026 at 25-40%. This is the category where the gap between digital product representation and physical product reality is widest.
Size charts across Indian fashion brands are inconsistent; a medium in one brand is a small in another. Product photography optimises for visual appeal rather than accurate colour and texture representation. The result is a buyer who genuinely intended to purchase but receives a product that does not match their expectation.
This is an information problem, not a fraud problem, and it is addressable through listing quality improvements, detailed size guides with centimetre measurements, and video content that shows fabric texture and drape in natural light.
4. Footwear COD Return Rate: 20-30%
 Footwear is the second-highest category in COD return rates by category in India 2026 at 20-30%, with size issues accounting for over 60% of stated return reasons across Amazon and Flipkart India.
The specific challenge in Indian footwear ecommerce is that sizing conventions vary by manufacturer; a size 8 in one brand is a size 9 in another, and most product listings still use only numerical sizing without foot length measurements in millimetres.
Brands that publish foot length ranges alongside standard sizing see 12-15% lower return rates on those SKUs. The fix is a content investment, not an operational one, but it has a direct impact on the COD return rates by category in India 2026 numbers that footwear brands are living with.
5. Electronics and Accessories COD Return Rate: 10-15%
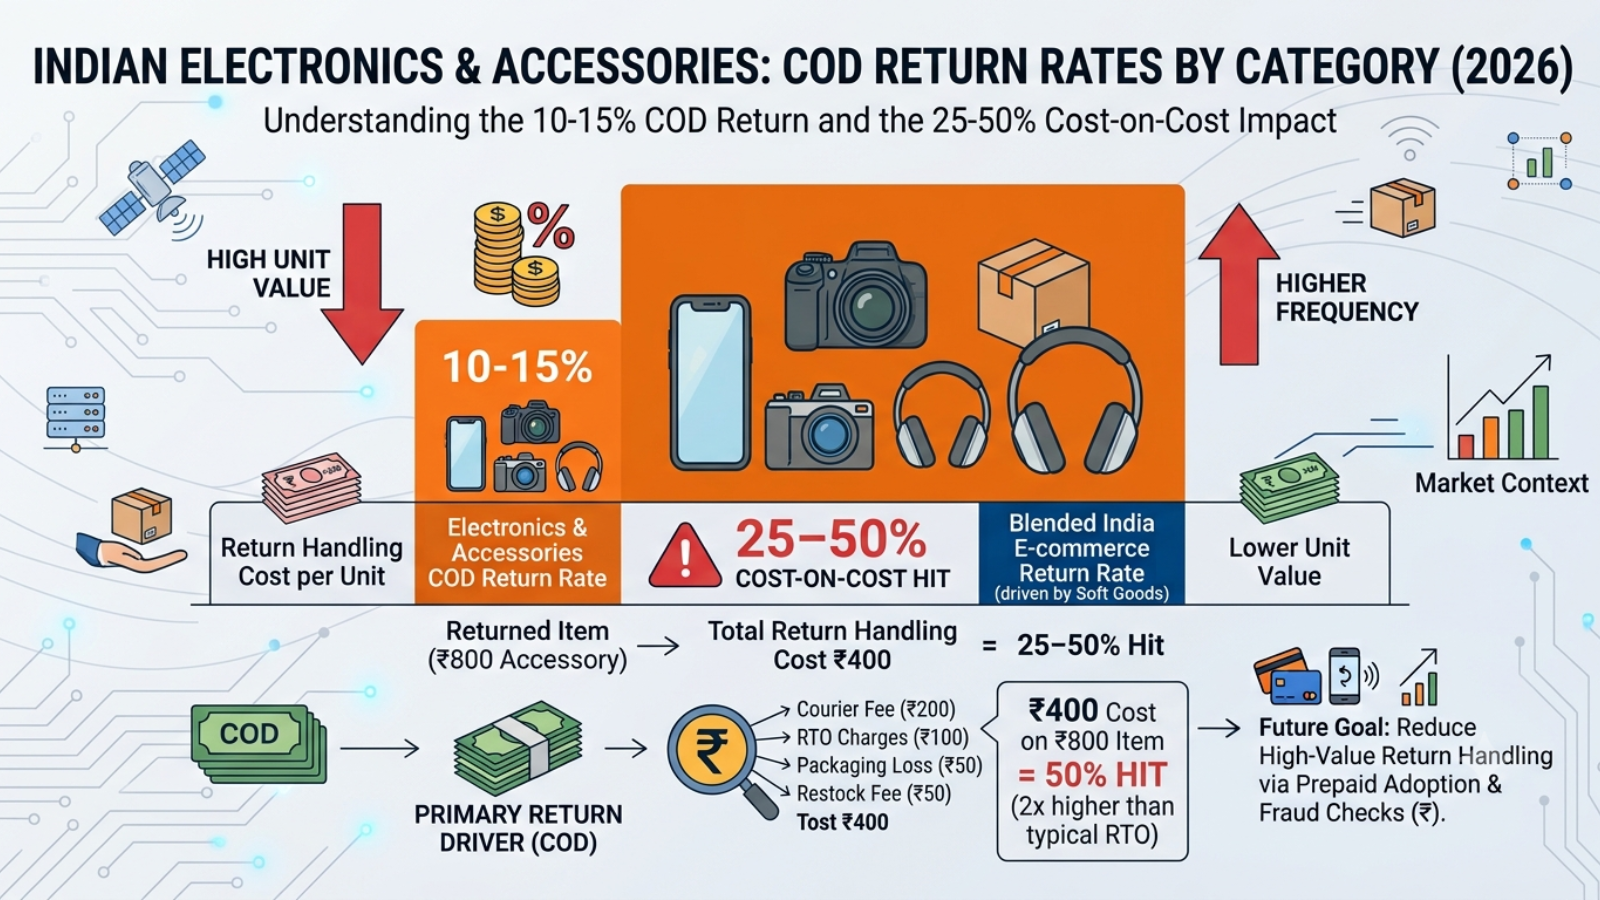 Electronics returns at 10-15% on COD, lower than soft goods categories in the COD return rates by category in India 2026 picture, but the cost per return is 2-3x higher due to product value. A returned mobile accessory at ₹800 costs ₹200-400 in total return handling, representing a 25-50% cost-on-cost hit.
The primary drivers in electronics COD returns are defective product claims and wrong items delivered. Both are operationally addressable. Scan-based verification at the pack station, confirming the correct item and serial number before dispatch, reduces wrong-item-delivered returns to near zero.
Effilo implemented scan-based pack verification through Base.com and eliminated the wrong-item-delivered category from their return reasons entirely, directly improving their position in the COD return rates by category in the 2026 electronics benchmark.
6. Beauty and Personal Care COD Return Rate: 18-22%
 Beauty and personal care records COD return rates of 18-22% in COD return rates by category in India 2026 data, with “product not as described” and “allergic reaction or skin sensitivity” as the top two stated return reasons on Indian platforms.
The core challenge is that beauty is a sensory category; texture, fragrance, and colour payoff cannot be communicated digitally. India’s beauty D2C market is growing at over 25% annually, with a large share of new buyers coming from tier 2 and tier 3 cities, making their first online beauty purchase.
First-time category buyers have return rates 30-40% higher than repeat buyers because their expectations are calibrated by offline experience. Accurate shade swatches, ingredient transparency, and skin-type suitability guides are the primary levers for reducing beauty COD returns.
7. Home Furnishings and Décor COD Return Rate: 15-20%
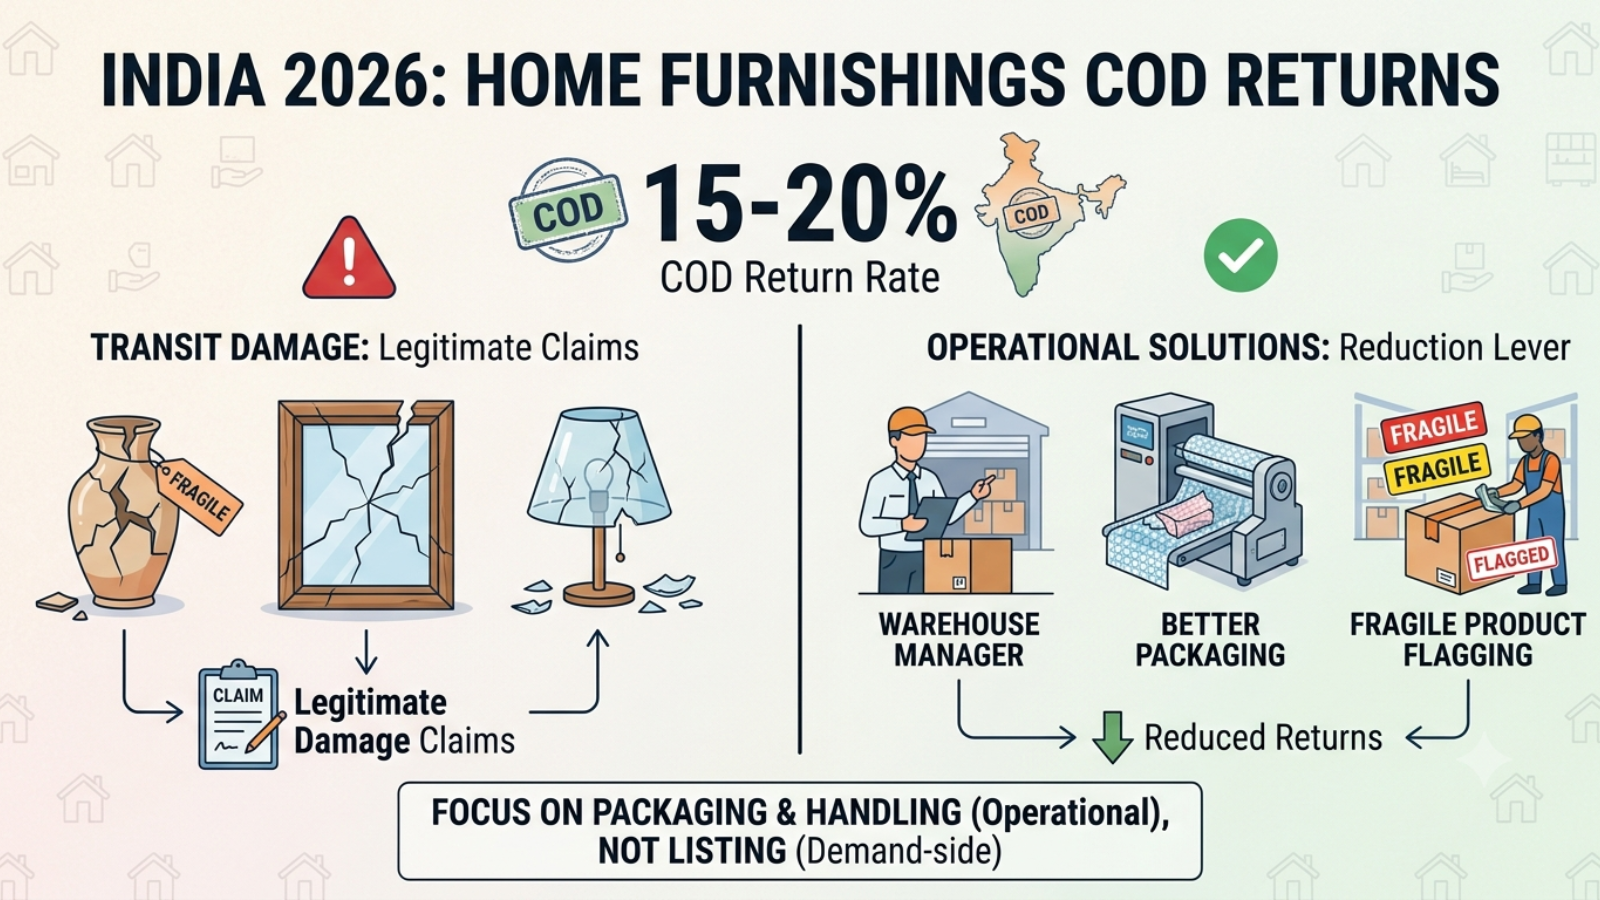 Home furnishings and décor returns at 15-20% on COD in COD return rates by category in India 2026, with transit damage accounting for a disproportionate share due to product fragility.
Unlike fashion or beauty, where the return driver is expectation mismatch, home furnishings returns are often legitimate damage claims, as the product arrived broken. This makes the home category unique: the return rate reduction lever is primarily operational (better packaging, fragile product flagging at the warehouse) rather than demand-side (listing quality, buyer intent filtering).
Brands in this category that implement fragile SKU flags in their OMS, triggering double-box packing instructions at the warehouse, see transit damage claims drop by 30-40%.
8. Books, Stationery, and Education Products COD Return Rate: 3-6%
 Books and stationery record the lowest COD return rates in the COD return rates by category in India 2026 data at 3-6%.
This category has structural return resistance: the product is low-value, the buyer’s expectation is set by a clearly visible title and ISBN, and there is no size, colour, or sensory element that can create an expectation gap.
The small return volume that does occur is almost entirely wrong-item-delivered, an operational error, not a buyer behaviour issue. For D2C brands operating in this category, the priority is not return rate reduction but order accuracy at the pack station.
9. FMCG and Grocery COD Return Rate: 3-6%
 FMCG and grocery records COD return rates below 5% in COD return rates by category in India 2026 across most subcategories, the second-lowest category after books. Returns in this category are driven by wrong items delivered and damaged or leaking packaging, rather than buyer change of mind.
The low return rate reflects high product familiarity: buyers know exactly what they are ordering because they have purchased the product offline before. The implication for Indian FMCG brands is that COD return management investment should focus on packaging integrity and fulfilment accuracy rather than demand-side buyer intent filtering.
10. Tier 2 and Tier 3 Cities Generate 65-70% of All COD Orders
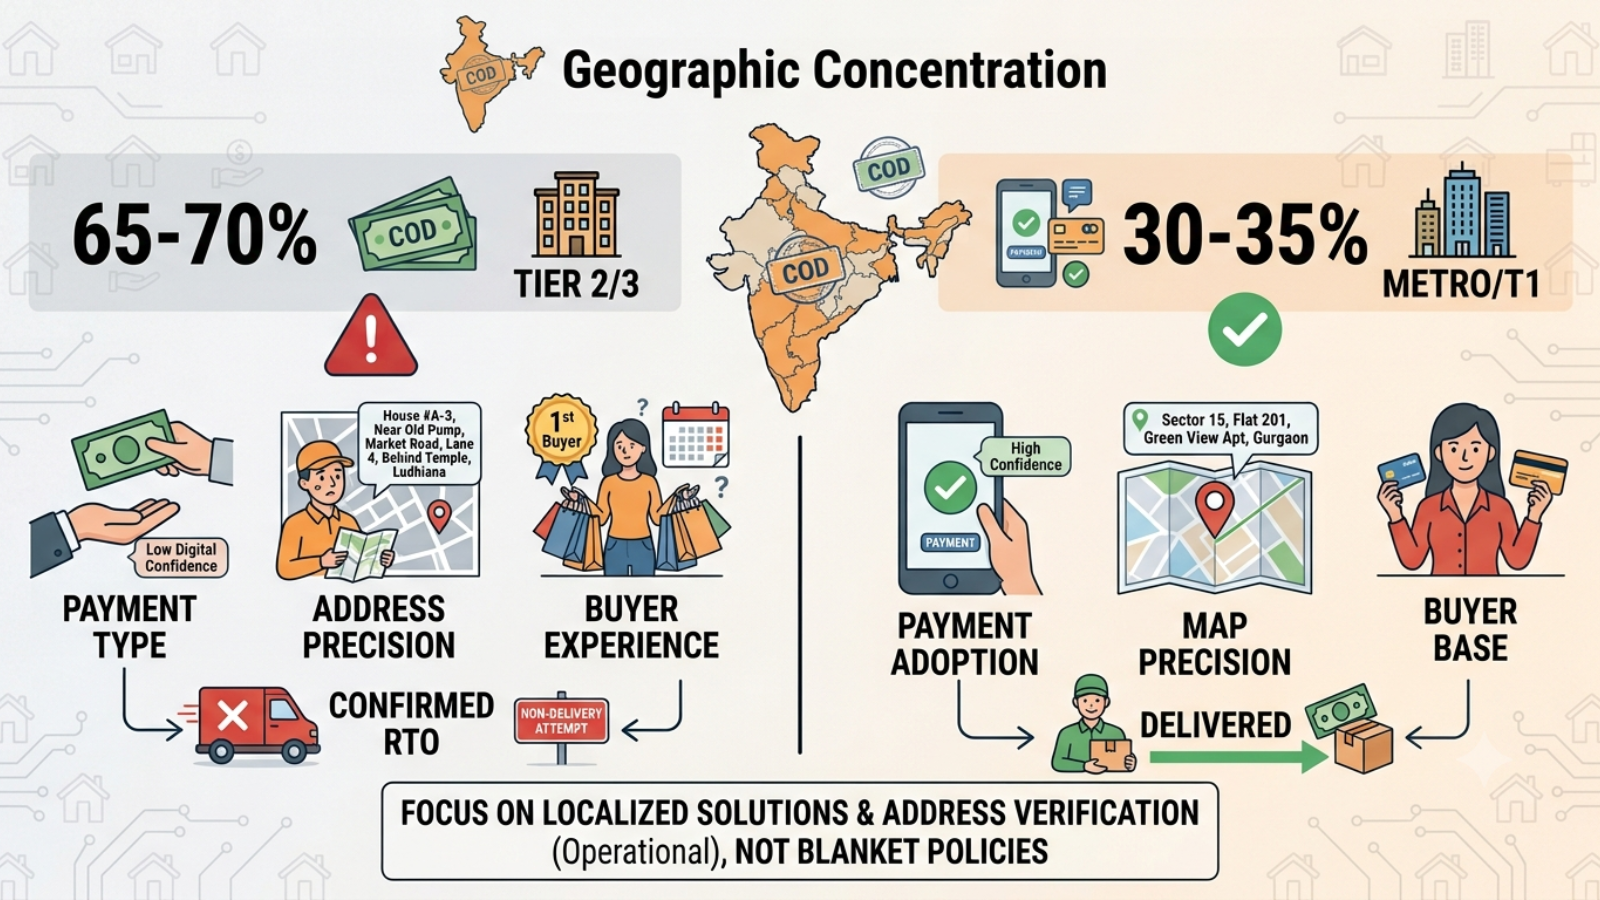 Tier 2 and Tier 3 cities account for 65-70% of total COD order volume in India, but generate 72-75% of all COD non-delivery attempts, the step immediately before a return in most Indian fulfilment flows.
This geographic concentration in COD return rates by category in India 2026 data reflects multiple converging factors: lower digital payment confidence driving COD preference, less precise address data increasing delivery failure rates, and higher first-time buyer concentration creating less purchase commitment.
Brands selling significantly into tier 2 and tier 3 markets need to address verification at order placement, not just at the point of dispatch. Base.com’s order management layer includes pincode-level serviceability checks and address standardisation at ingestion, filtering undeliverable addresses before they enter the fulfilment pipeline.
11. Non-Delivery Attempts Convert to Returns at 85-90%
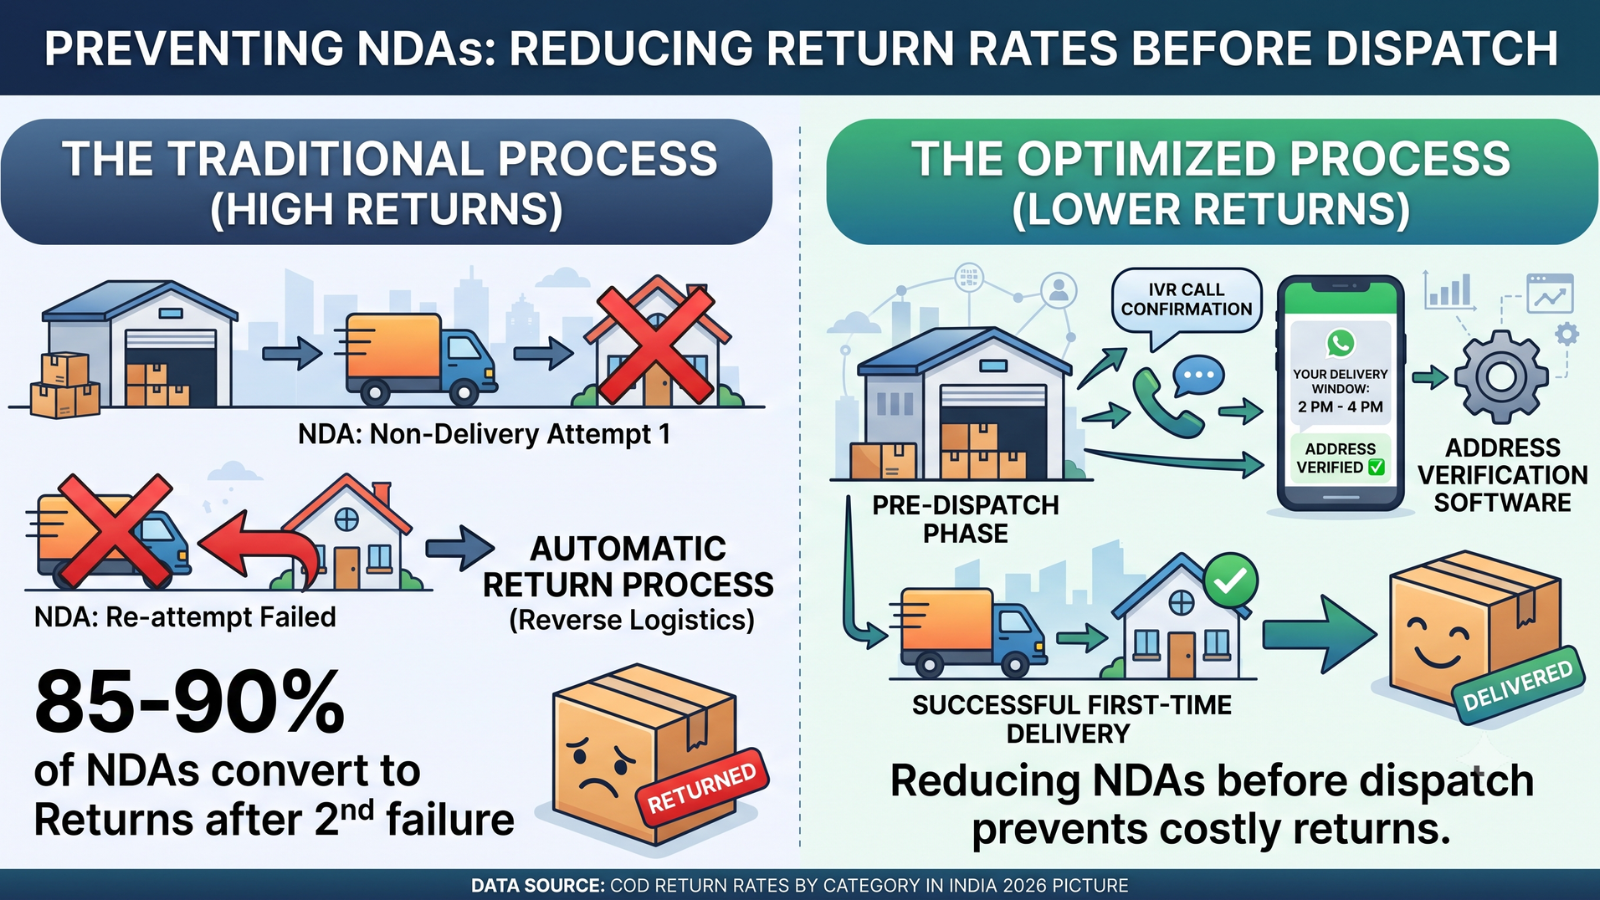 Non-delivery attempts (NDAs), where the courier reaches the delivery address but cannot complete delivery, convert to returns at 85-90% when the first re-attempt also fails. In the COD return rates by category in India 2026 picture, NDAs are operationally equivalent to returns.
The difference is that an NDA is preventable before dispatch, while a return requires a reverse logistics cycle. Brands that reduce NDA rates through pre-dispatch communication, IVR confirmation calls, WhatsApp delivery window notifications, and address verification are reducing their effective return rate before the product ever leaves the warehouse.
This is the highest-leverage intervention available in the COD return rates by category in India 2026 operational toolkit for India.
12. Average Cost of a Failed COD Delivery: ₹120-180 Visible, ₹180-350 True
 The visible cost of a failed COD delivery, forward shipping plus reverse pickup, is ₹120-180 for a standard 500g shipment.
The true cost in any honest COD return rates by category in India 2026 analysis includes repackaging labour (₹15-25), QC assessment (₹10-20), restocking (₹10-15), and the working capital cost of inventory locked in transit for 7-12 days during the return cycle.
For damaged or unsaleable returned goods, which account for 15-20% of returns across categories, add the full product cost. True cost per COD return for most Indian D2C brands is ₹180-350 per order before product damage, and significantly higher for high-value SKUs in electronics and home furnishings.
13. Top 8-10% of COD Returners Generate 40-45% of Return Volume
 Analysis of COD return patterns across Indian D2C brands consistently shows that the top 8-10% of COD customers by return frequency generate 40-45% of total COD return volume. This concentration is the most actionable insight in COD return rates by category in India 2026 data.
It means that applying broad COD restrictions to all customers to manage a problem caused by a small cohort is the wrong intervention; it destroys conversion for the 90% of buyers who behave normally. The correct intervention is identifying the high-return cohort through your OMS data layer and applying targeted restrictions specifically to that group.
Base.com’s repeat returner flagging identifies this cohort automatically and applies configured restrictions, COD order value caps, mandatory IVR confirmation, or COD suspension, without affecting normal buyers.
14. Fraudulent COD Orders Account for 3-5% of Total COD Volume
 Fake and fraudulent COD orders, placed with no intention of accepting delivery, account for 3-5% of total COD volume on most Indian marketplaces and D2C platforms. In the COD return rates by category in India 2026 breakdown, fraud is concentrated in three categories: electronics (high resale value of legitimately packaged returns), high-value fashion (designer and premium segment), and luxury personal care.
Fraud detection requires OMS-level data: cross-referencing delivery addresses, phone numbers, and buyer history to flag orders that match known fraudulent patterns before dispatch.
Base.com integrates with RTO prediction services that score each COD order at placement, enabling automatic COD restriction on high-fraud-risk orders.
15. IVR Confirmation Calls Reduce COD Non-Delivery Rates by 30-40%
 IVR (Interactive Voice Response) confirmation calls placed before dispatch are the highest single-intervention return reducer in COD return rates by category in India 2026 operational data. When a customer receives a call confirming their order and expected delivery window before the product ships, non-delivery rates drop by 30-40%.
The mechanism is simple: buyers who placed an impulse order and forgot about it either cancel proactively (cheaper than a return) or mentally re-engage with the purchase and accept delivery.
Brands implementing IVR confirmation through Base.com configure it as an OMS rule, triggered automatically for COD orders above a defined value threshold, without manual coordination for each order.
16. WhatsApp Confirmation Messages Reduce COD Return Rates by 18-25%
 WhatsApp order confirmation messages sent before dispatch reduce COD return rates by 18-25% compared to brands using no pre-delivery communication in COD return rates by category in India 2026 data.
The WhatsApp message serves a dual function: it confirms the order details (creating accountability for the buyer), and it provides a low-friction cancellation option (filtering out buyers who no longer want the product before the forward shipment cost is incurred).
Brands that include a single-tap “confirm order” or “cancel order” link in their WhatsApp message see higher engagement than text-only messages. Base.com triggers WhatsApp confirmation flows automatically at the point of COD order confirmation, with cancellations updating order status in real time.
17. Same-Day and Next-Day Delivery Reduces COD Return Rates by 12-18%
 Faster delivery reduces COD return rates by 12-18% compared to standard 3-5 day delivery in COD return rates by category in India 2026 analysis.
The mechanism is psychological: the shorter the gap between order placement and delivery, the less time a buyer has to change their mind, forget the purchase, or find the product cheaper elsewhere.
Quick commerce channels, Blinkit, Zepto, Swiggy Instamart, see COD return rates of 8-12%, partly because 10-minute delivery eliminates the change-of-mind window almost entirely. For standard ecommerce brands, same-day delivery is operationally complex, but next-day delivery to tier 1 city pincodes is achievable with multi-node fulfilment routing.
Base.com’s warehouse routing engine assigns orders to the nearest stocked fulfilment node automatically, reducing delivery time without requiring manual intervention.
18. COD Return Rates Spike 35-45% During Festive Sale Periods
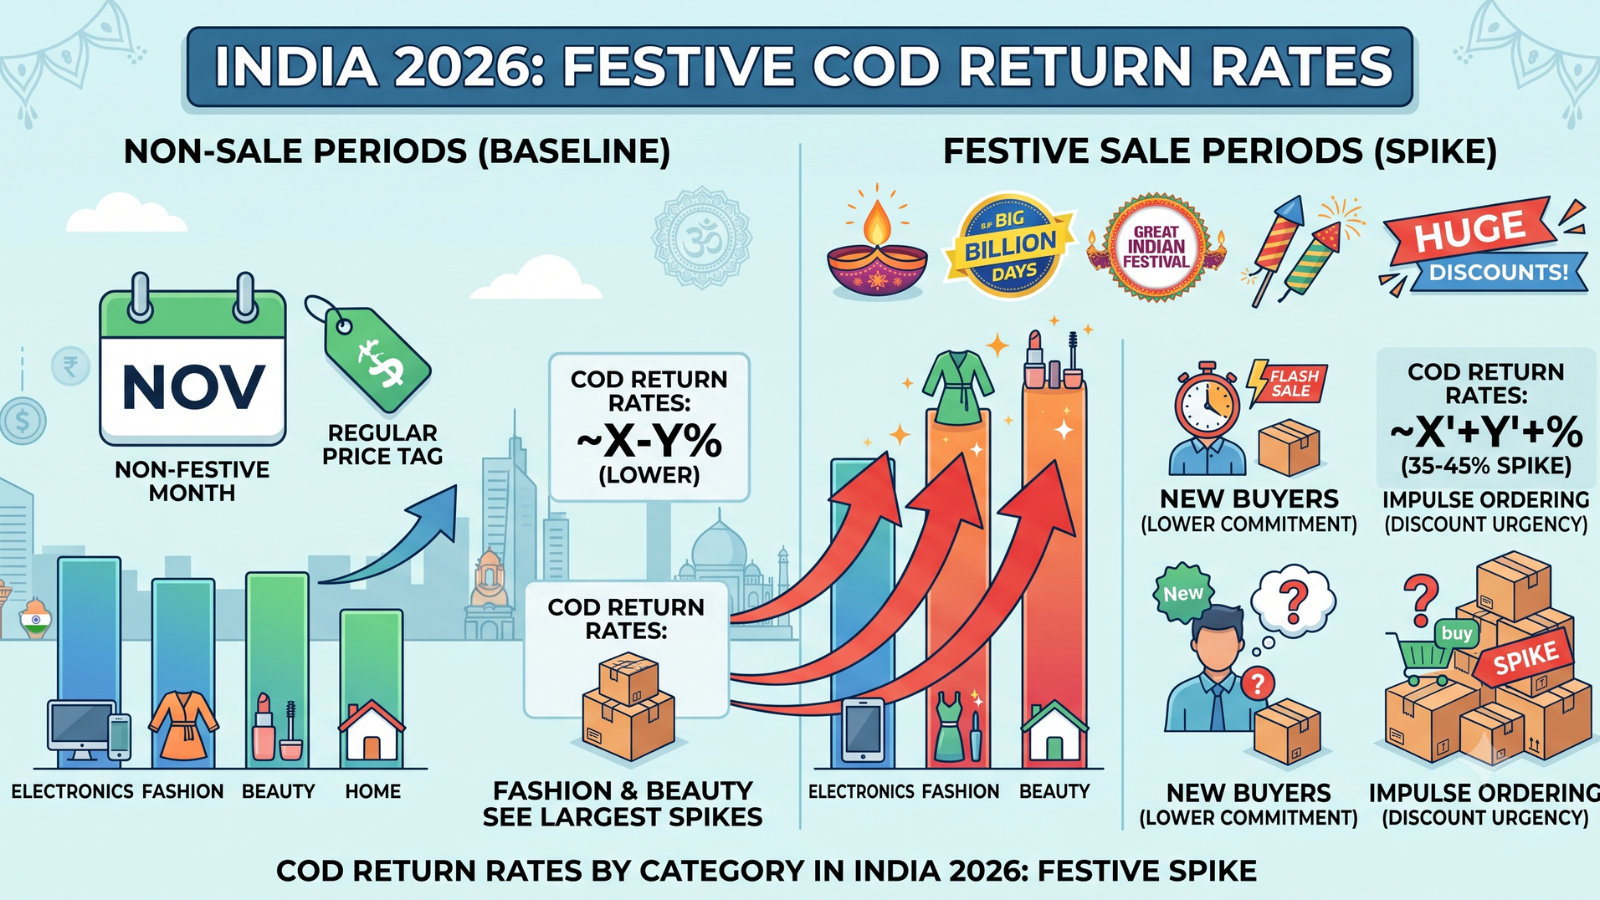 COD return rates by category in India 2026 data show a consistent 35-45% spike in return rates during festive sale periods, Diwali, Big Billion Days, Great Indian Festival, compared to non-sale trading periods.
The spike is driven by two converging factors: first-time buyers with lower purchase commitment entering the market during sale events, and impulse ordering behaviour amplified by discount urgency. Fashion and beauty see the largest festive spikes.
Operationally, brands need to increase IVR confirmation thresholds and tighten COD eligibility rules during the 15-day window before and during major sale events, not revert to normal rules once the sale is live.
19. Fashion D2C Brands on Shopify See Lower COD Return Rates Than on Amazon
 Fashion D2C brands on Shopify see COD return rates of 18-25% compared to 28-35% for identical SKUs on Amazon India, a gap of 8-12 percentage points for the same product. This channel effect in COD return rates by category in India 2026 data reflects differences in buyer intent and discovery context.
A buyer who navigates directly to a brand’s Shopify store has higher purchase intent than a buyer who discovers the same product through Amazon’s algorithm.
The implication for Indian D2C brands is that investing in direct channel growth, through performance marketing to their own D2C store, delivers a double return: higher margins and lower return rates on the same SKUs.
20. COD-to-Prepaid Nudges Convert 15-22% of COD Orders to Prepaid
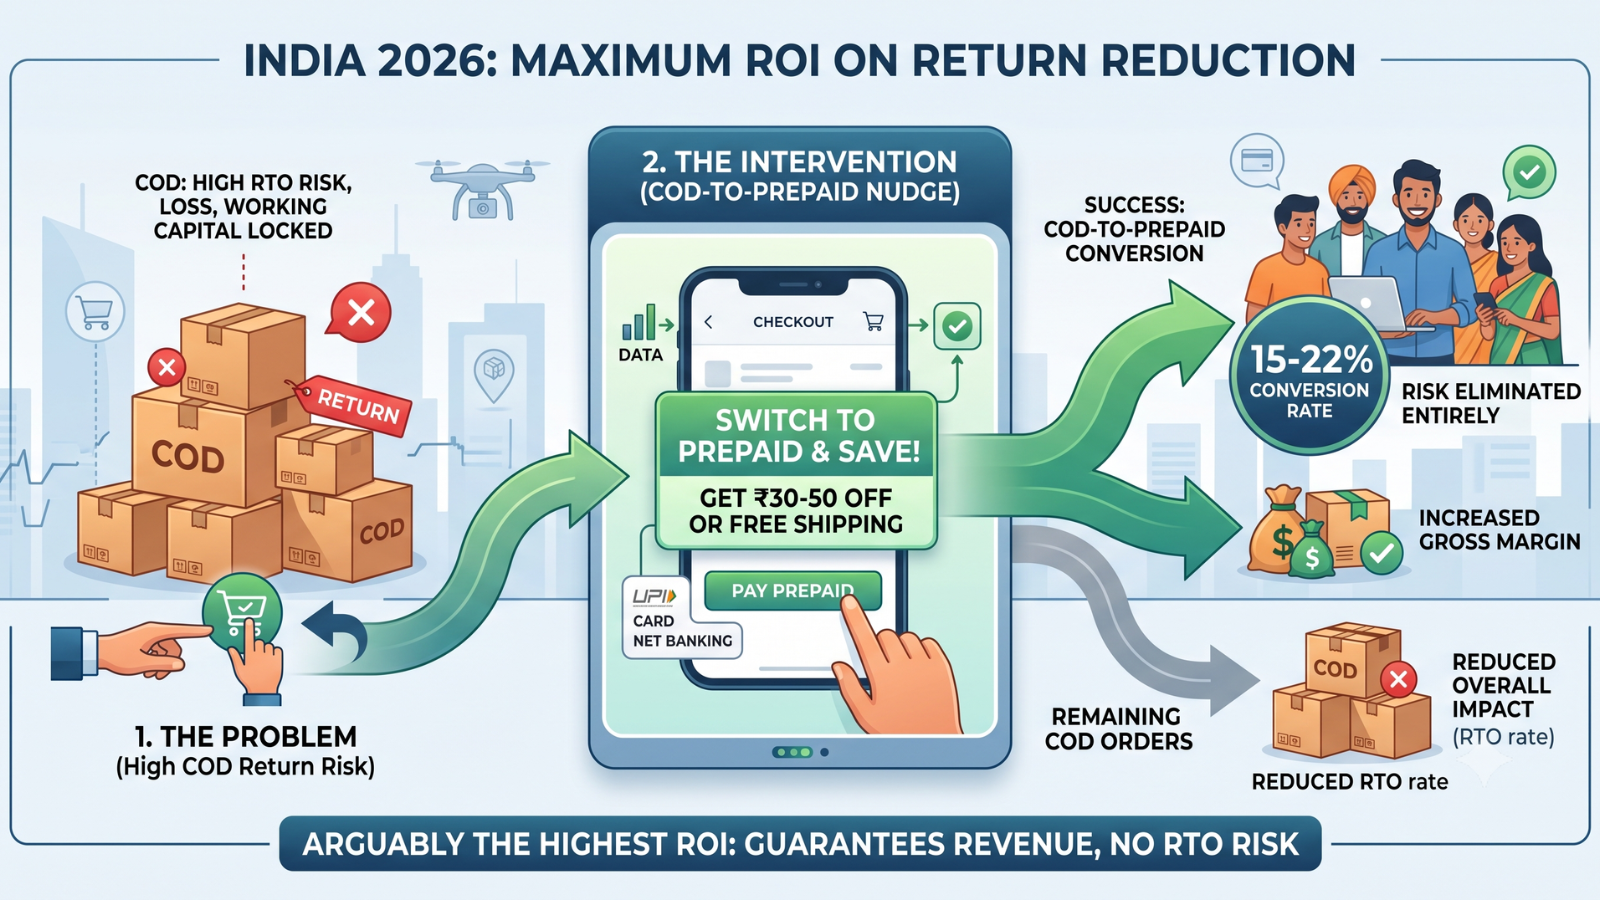
 Brands that implement COD-to-prepaid nudges, offering a ₹30-50 discount or free shipping for switching payment method at checkout, convert 15-22% of COD orders to prepaid in COD return rates by category in India 2026 data.
This is arguably the highest-ROI return reduction intervention available because it eliminates return risk on converted orders entirely rather than reducing it partially.
A brand doing 500 COD orders per day that converts 18% to prepaid removes 90 orders daily from their COD return exposure. At a 30% COD return rate, that is 27 fewer returns per day, approximately ₹5,000-9,000 in daily return cost savings at ₹180-350 per return. Annualised, that single intervention recovers ₹18-32 lakh for a mid-sized Indian D2C brand.
COD Return Rates by Category in India 2026: Master Benchmark Table
| Product Category | COD Return Rate 2026 | Prepaid Return Rate 2026 | COD vs Prepaid Gap | Primary Return Driver | True Cost per Return (₹) |
|---|---|---|---|---|---|
| Fashion and apparel | 25-40% | 12-18% | 2.0-2.2x | Size mismatch, colour variance | 200-280 |
| Footwear | 20-30% | 10-14% | 2.0-2.1x | Size issues | 180-240 |
| Beauty and personal care | 18-22% | 8-11% | 2.0-2.2x | Product not as described | 150-200 |
| Home furnishings and décor | 15-20% | 7-10% | 2.0-2.1x | Transit damage | 220-320 |
| Electronics and accessories | 10-15% | 5-7% | 1.9-2.1x | Defective, wrong item | 250-450 |
| Toys and baby products | 10-14% | 5-7% | 1.9-2.0x | Product not as described | 160-220 |
| Sports and fitness | 12-16% | 6-8% | 1.9-2.0x | Size or specification mismatch | 170-240 |
| Health and wellness | 8-12% | 4-6% | 1.8-2.0x | Wrong item, packaging damage | 130-180 |
| FMCG and grocery | 3-6% | 1-3% | 1.8-2.0x | Wrong item, damaged packaging | 80-120 |
| Books and stationery | 3-6% | 1-3% | 1.8-2.0x | Wrong item delivered | 60-90 |
How to Use COD Return Rates by Category in India 2026 Data Operationally
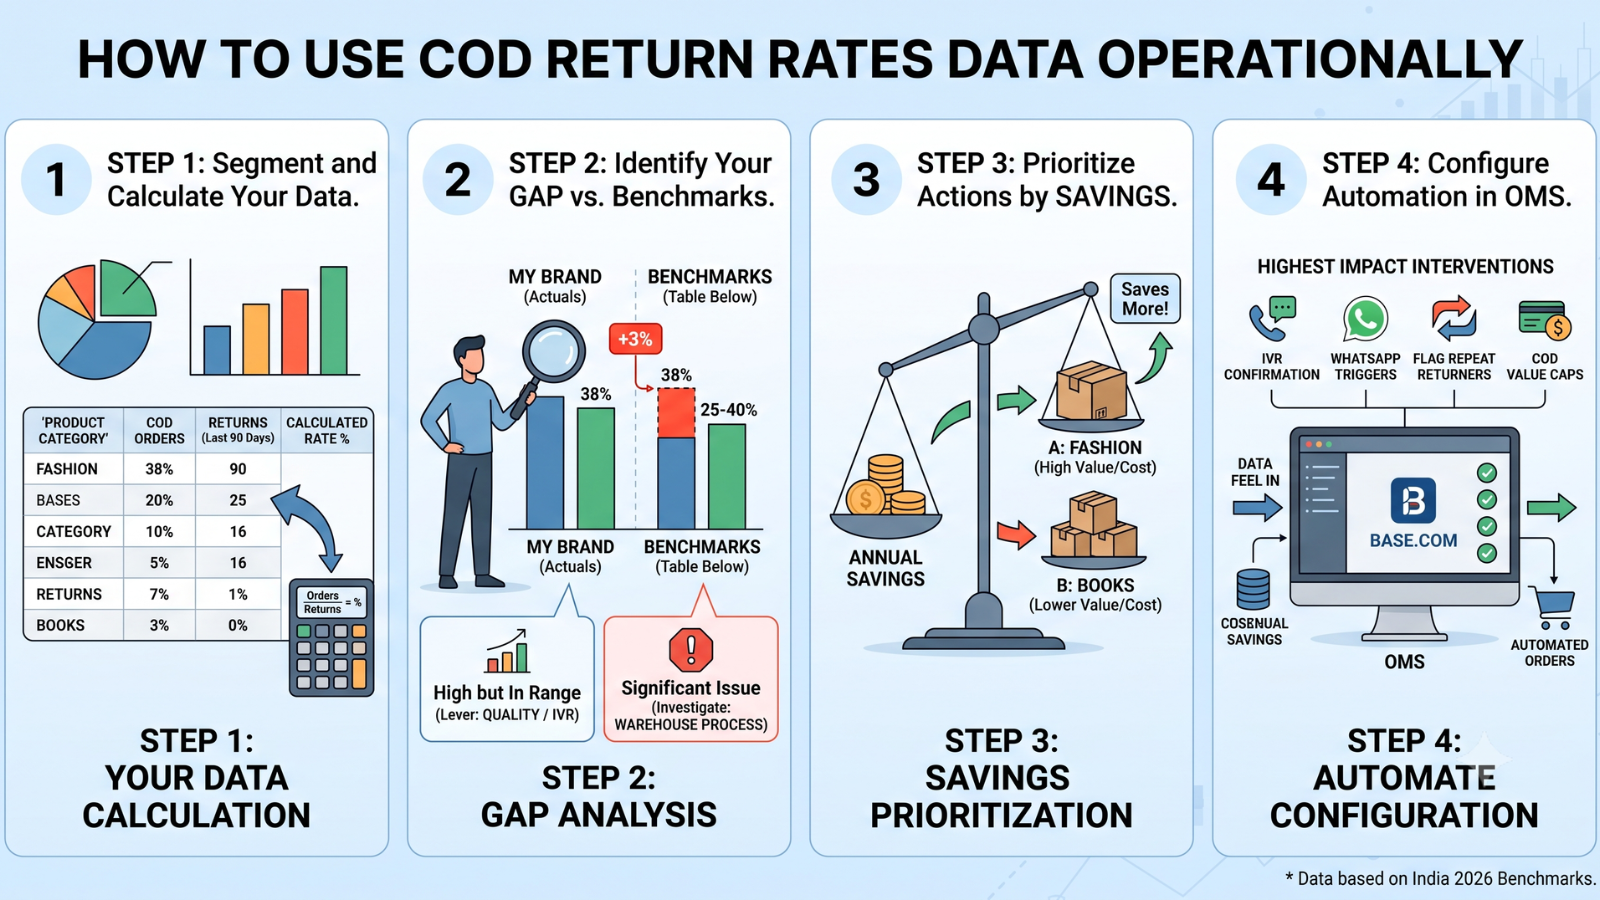
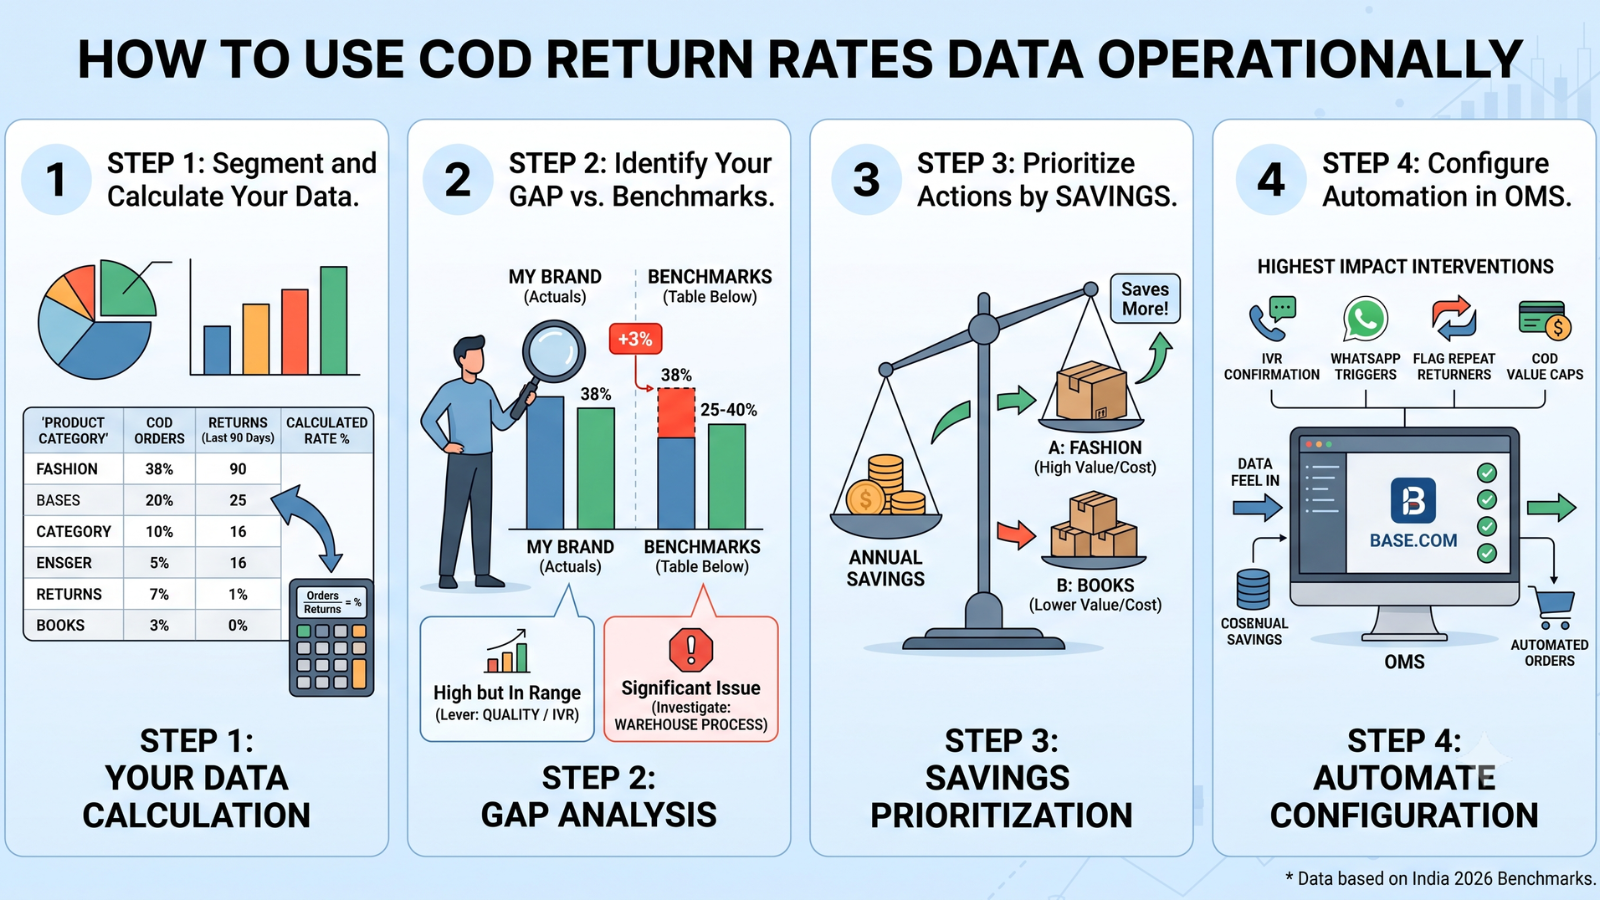 Understanding COD return rates by category in India 2026 benchmarks is only useful if it drives operational decisions. Here is how to translate the data into action:
Step 1: Calculate your category-specific COD return rate. Pull your last 90 days of COD orders and returns, segmented by product category. Compare against the COD return rates by category in India 2026 benchmarks in the table above.
Step 2: Identify your gap. If your fashion COD return rate is 38% against a 25-40% benchmark, you are at the high end but within range; listing quality and IVR confirmation are your levers. If your electronics COD return rate is 22% against a 10-15% benchmark, you have a significant operational problem, likely wrong-item-delivered or a defective product issue, that requires immediate warehouse process investigation.
Step 3: Prioritise interventions by gap size and category value. A 5-point improvement in fashion return rates saves more than a 5-point improvement in books because the forward and reverse logistics costs are higher. Use the true cost per return column to calculate your annual savings from each percentage point of improvement.
Step 4: Configure OMS rules for the highest-impact interventions. IVR confirmation, WhatsApp triggers, repeat returner flagging, and COD value caps are all OMS-level configurations in Base.com, not separate tool investments. Brands using Base.com to manage COD return rates by category in India 2026. Performance configures these rules once, and the system applies them automatically to every qualifying order.
How Base.com Clients Are Reducing COD Return Rates in 2026
Brands are reducing COD return rates by combining pre-dispatch validation, intelligent restrictions, and fulfilment accuracy improvements through structured system-driven workflows.
- COD confirmation workflows reduced non-delivery attempts significantly within 60 days, leading to over 20% drop in COD return rates versus pre-implementation baseline.
- Repeat returner identification helped isolate high-risk customers contributing disproportionate returns. Restricting COD and enforcing IVR confirmation for this segment reduced their COD return rate by 35% within 90 days, without impacting normal customers.
- Scan-based pack verification improved fulfilment accuracy, cutting wrong-item deliveries from 2-3% to under 0.3%, saving ₹4-6 lakh annually in return handling costs.
- Address verification and serviceability checks filtered undeliverable orders before dispatch, reducing at-door COD rejections by 28% within the first quarter.
These outcomes highlight a consistent pattern: structured, automated interventions at key decision points outperform reactive logistics fixes in reducing COD return rates.
Where COD Return Rates by Category in India 2026 Are Heading
 COD return rates in India are no longer just a logistics issue; they are becoming a category-specific operations challenge. As D2C brands scale, return behavior is increasingly shaped by product type, customer intent, and fulfilment quality rather than just courier performance.
- RTO prediction integration. Indian logistics operators, including Delhivery and Shiprocket, now offer RTO prediction scores at order placement. These scores, based on address quality, buyer history, and pincode-level delivery success rates, allow brands to automatically restrict COD on high-risk orders. Early adopters report a 15-20% reduction in RTO rates on flagged orders. Base.com integrates with RTO prediction APIs to apply these scores as automatic order management rules.
- UPI-COD hybrid payment. A new flow, where the customer pays ₹1 via UPI to confirm a COD order, is being piloted by Indian D2C brands. Early data suggests this token commitment reduces COD return rates by 20-25% without the conversion loss of requiring full prepayment. As this model scales, COD return rates by category in India 2026 benchmarks will improve across the board for brands that adopt it.
- Account-level marketplace restrictions. Amazon and Flipkart are expanding buyer-level COD restrictions for high-return accounts. For brands on their own D2C channels, implementing equivalent account-level restrictions through their OMS replicates this protection outside the marketplace, ensuring COD return rates by category in India 2026 improvements on marketplaces translate to D2C channel improvements as well.
In 2026, COD return rates are expected to diverge sharply by category. High-touch categories like fashion and footwear will continue to see elevated return rates due to sizing and expectation gaps, while categories like electronics, consumables, and auto parts will trend lower due to higher purchase intent and lower ambiguity.
The key shift is structural. Brands are moving from broad, one-size-fits-all return reduction strategies to category-level optimisation, using data to identify why returns happen and applying targeted interventions.
The direction is clear:
- COD return rates will not disappear, but they will become more predictable and controllable
- Brands investing in pre-dispatch validation, customer segmentation, and fulfilment accuracy will outperform category averages.
- Operations, not just logistics, will define return performance
In short, COD return rates in India are moving from being an uncontrollable cost to a manageable, optimisable metric for serious D2C operators.
Base.com is an order and warehouse management platform built for Indian D2C and B2B brands. It includes native COD management workflows, IVR confirmation, WhatsApp order triggers, repeat returner flagging, RTO prediction integration, and COD-to-prepaid conversion tracking as standard features within the OMS layer.



[…] but wrong. Wrong shipments are the largest controllable driver of returns. And in a market where COD return rates run between 25-30% across categories, controllable means […]
[…] orders account for 55-65% of ecommerce volume in Tier 2 and Tier 3 Indian cities, and COD return rates run at 25-30% nationally. Every one of these returns has to flow back into accurate stock counts, […]
[…] brand with an operations problem, specifically, pre-dispatch verification, courier allocation, and COD management, that is solvable with the right tooling and […]
[…] management in D2C India that intercepts high-RTO-risk COD orders before dispatch, rather than processing the return after the courier fails, is the highest-leverage […]
[…] of ecommerce volume in Tier 2 and Tier 3 cities, the fastest-growing markets for Indian D2C brands. COD return rates run at 25-30% nationally, compared to single digits for prepaid orders elsewhere. Every one of […]
[…] in India is customization. Unicommerce uses fixed order statuses. For a brand that needs a COD verification step between order confirmation and picking, or a quality check status between packing and […]
[…] orders because customers have more financial stake in the purchase. It does not materially reduce COD RTO rates, because the customer who paid nothing has nothing to lose by […]