
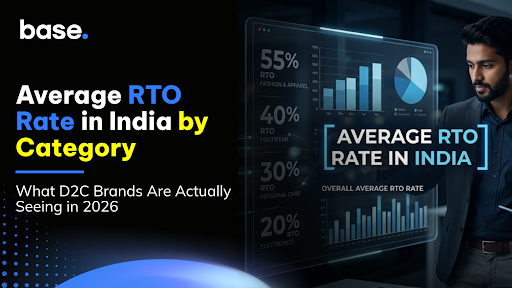
Most discussions of RTO in Indian D2C treat it as a single national number. The national average, 20-30%, gets cited, debated, and used as a benchmark. Then a fashion brand applies that benchmark and discovers its actual RTO is 38%. A grocery brand applies the same number and discovers that theirs is 4%. The aggregate hides the variation that actually matters for operations decisions.
India’s D2C market crossed ₹2.5 lakh crore in GMV in 2025. Behind those numbers lies a structural profitability crisis: the national average RTO rate for D2C brands in India sits between 20-30%. For COD-heavy categories like fashion, footwear, and general merchandise, it can touch 40%.
Understanding RTO rates in India in the ecommerce 2026 at the category level, not the national aggregate level, is the operational foundation of accurate P&L modelling, correct courier allocation decisions, and realistic CAC payback calculations. A brand that models a 22% national average RTO into its unit economics but actually ships in the 35-40% fashion tier is running a structurally unprofitable business without knowing it.
This guide covers 10 categories in detail, the RTO rate range, the specific reasons that drive it, what brands in that category are actually seeing, and the operational lever most likely to move the needle.
Why Category-Level RTO rates in India in the ecommerce 2026 Vary So Dramatically
Before the category breakdowns, it is worth establishing the structural drivers that create category-level variation in the first place.
Typical RTO rates in India range from 20 to 30%, depending on region, product type, courier reliability, and customer behaviour. COD orders have the highest RTO rate, reaching up to 26% in India, compared to less than 2% for prepaid orders.
Four variables drive category-level RTO divergence.
- Purchase intent certainty differs by category. A customer who spends 20 minutes researching a supplement dosage before ordering has high intent. A customer who impulse-orders a ₹299 graphic tee at midnight during a sale has low intent. Low-intent purchases generate disproportionately high RTO rates, not because the product is wrong, but because the customer’s commitment to receive it was never firm.
- Sizing and fit uncertainty is category-specific. Fashion, footwear, and ethnic wear generate returns because customers cannot verify fit before ordering. Categories where size is irrelevant, such as electronics, supplements, and home care, do not share this failure mode.
- COD prevalence varies by category and by customer segment. Categories popular with first-time online buyers in Tier 2 and Tier 3 cities, such as affordable fashion, general merchandise, and home goods, carry structurally higher COD rates, which translates directly into higher RTO rates. COD represents 58-64% of orders in Tier-2 and Tier-3 markets, yet contributes to 76-83% of total RTO volume.
- Average order value affects RTO psychology. A customer who ordered a ₹499 product on COD has no financial commitment to receive it. A customer who ordered a ₹8,000 product on prepaid is highly motivated to be home for the delivery.
Understanding these structural drivers is essential to interpreting RTO rates in India in the ecommerce 2026 at the category level, because the operational intervention required differs by driver.
Category 1: Fashion and Apparel, RTO Rate: 25-40%
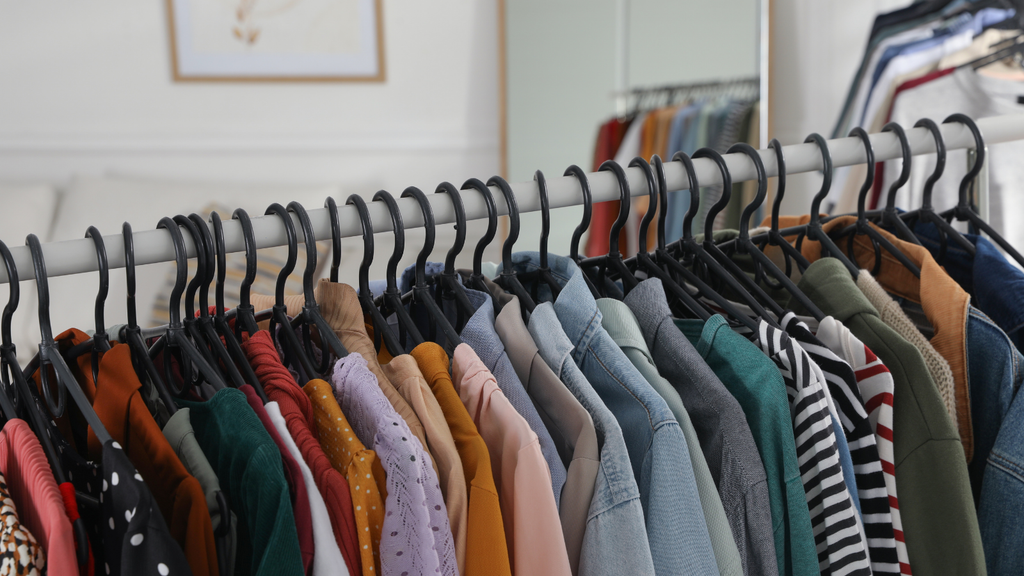
Fashion is the highest-RTO category in Indian D2C by a significant margin. For COD-heavy fashion brands selling to Tier 2 and Tier 3 customers, the upper end of this range, 40%, is not exceptional. It is the operational baseline.
Why is fashion RTO this high
Three distinct failure modes stack on top of each other in fashion.
The first is sizing uncertainty. India does not have a standardised sizing system across brands. A medium from one brand fits like a small from another. A customer who orders based on the size they bought elsewhere six months ago has a meaningful probability of ordering the wrong size, and when that order arrives on COD, and the fit is wrong, they refuse it.
Fashion items, in particular, witness heightened return rates due to sizing inconsistencies, the absence of universally accepted fit guides across brands, and the lack of a tactile try-before-you-buy experience that physical retail environments provide.
The second is impulse ordering. Fashion D2C brands drive significant volume through Instagram and influencer campaigns, where the purchase decision is made in seconds. A customer who makes an impulse purchase at 11 PM during a sale event and wakes up the next morning with buyer’s remorse has already placed the order, and it is already being packed. When it arrives on COD four days later, the impulse has passed.
The third is bracketing, ordering multiple sizes or variants with the intention of keeping one and returning the rest. The primary driver is fit and sizing uncertainty; customers order multiple sizes with the intent to keep one and return the rest, a behaviour called bracketing, practised by 63% of online shoppers.
What brands are doing to reduce it
Size guides with actual measurements rather than S/M/L labels, IVR verification within 5 minutes of a COD fashion order, and COD-to-prepaid conversion incentives at checkout are the three highest-impact interventions.
A good RTO rate for COD e-commerce in 2026 is 15-20% for well-optimised operations, with top performers achieving 10-15%. Fashion brands at 10-15% RTO are outliers, but they are real, and the gap between 38% and 15% is entirely operational, not category-structural.
RTO rates in India in the ecommerce 2026 benchmark for fashion: 25-40% average; top performers 12-18%.
Category 2: Footwear, RTO Rate: 20-35%

Footwear sits just below fashion in RTO rate for the same fundamental reason: fit cannot be verified online. A shoe that is a UK 9 from one brand may run a half-size small from another. The customer who orders the same size they have worn for years discovers the fit is wrong at delivery, and on a COD order, refuses it.
The specific aggravating factor in Indian footwear D2C is the variation between formal, casual, and athletic sizing. A customer who buys formal shoes in size 9 and then orders sports shoes in the same size from a different brand has a meaningful probability of a misfit. The return logic is the same: when the product arrives COD, and the fit is wrong, the return is cost-free from the customer’s perspective.
What makes footwear different from fashion
The average order value in footwear is typically higher than in mass-market fashion, ₹800-₹3,000 for most D2C brands. This slightly reduces RTO rates on prepaid orders because customers have more financial stake in the purchase. It does not materially reduce COD RTO rates, because the customer who paid nothing has nothing to lose by refusing.
Footwear brands using virtual fit technology, where customers upload their foot measurements, report lower RTO rates than brands relying on standard size charts. The investment in fit-verification technology pays for itself in avoided reverse logistics costs within the first quarter of deployment at meaningful order volumes.
RTO rates in India in the ecommerce 2026 benchmark for footwear: 20-35% average; premium brands with better size guidance 12-20%.
Category 3: Electronics and Consumer Gadgets, RTO Rate: 8-18%

Electronics is one of the more controllable RTO categories in Indian D2C. Electronics averages a 11 to 15 percent return rate, significantly below fashion and footwear. The primary reason is that electronics purchases are generally considered and researched rather than impulse-driven, and size or fit is not a relevant failure mode.
The specific RTO drivers in electronics
Electronics returns predominantly stem from defective units or mismatched expectations, frequently arising from product descriptions that do not accurately represent the item.
The “mismatched expectations” driver is particularly important for understanding RTO rates in India in the ecommerce 2026 in this category. A customer who ordered a smartwatch expecting the battery life described in a marketing claim, and found it significantly different on actual use, initiates a return that is technically a customer satisfaction issue but is operationally manifested as an RTO if the return happens before delivery acceptance or as an exchange request immediately after.
Variant-level accuracy is the other major driver. An earphone that comes in four colours, and the customer ordered black but received navy, creates a return. A smartwatch that comes in two strap sizes, and the wrong size was dispatched, creates a return. Pick-and-pack scan validation at the warehouse eliminates this class of error.
What separates low-RTO electronics brands
Accurate, non-marketing product descriptions, with real-world battery life, actual dimensions, and honest performance data, are the single highest-impact content intervention for reducing electronics RTO.
Combined with barcode scan validation at packing and OTP-secured delivery for high-value units, top-performing electronics brands operate at 8-10% RTO.
RTO rates in India in the ecommerce 2026 benchmark for electronics: 8-18% average; top performers 6-10%.
Category 4: Beauty and Personal Care, RTO Rate: 5-15%

Beauty and personal care have among the lowest RTO rates of any D2C category in India. Beauty ranges from a 4 to 12 percent return rate.
The category-specific dynamics that keep RTO low are: products are small and lightweight (reducing handling damage during transit), size and fit are not relevant failure modes, and product descriptions are relatively easy to make accurate.
Why is the beauty RTO low but not zero
The primary RTO drivers in beauty are COD refusal and product expectation mismatch. A customer who ordered a face cream based on an Instagram ad and received a product that feels different from what was shown, a different texture, a different scent, may refuse the COD delivery.
This is largely a content accuracy problem: brands that set accurate product expectations through honest ingredient communication and texture descriptions see lower RTO rates than brands that present aspirational product imagery without functional accuracy.
Shelf-life proximity is a secondary driver. A customer who receives a personal care product with a best-before date that is only 60-90 days away has a legitimate reason to refuse, and brands with poor batch rotation in their warehouse generate this failure mode unnecessarily.
Batch tracking and FEFO as RTO reduction tools
Beauty brands that implement FEFO (First Expiry First Out) picking and batch tracking in their WMS structurally eliminate the near-expiry delivery failure. Base.com’s WMS includes batch tracking and FEFO enforcement; every pick task is assigned to the oldest compliant batch, ensuring products dispatched always have sufficient shelf life.
RTO rates in India in the ecommerce 2026 benchmark for beauty and personal care: 5-15% average; brands with accurate content and FEFO operations 3-8%.
Category 5: Health Supplements and Nutraceuticals, RTO Rate: 6-14%

Health supplements share much of beauty’s RTO profile, small, lightweight products with no fit or size variable. The category benefits from high purchase intent: customers buying protein powder, vitamins, or ayurvedic supplements have typically researched the product and made a considered decision. Impulse purchasing is less prevalent in this category than in fashion.
The specific RTO risk in supplements
The primary risk is expectation mismatch around flavour, texture, or mixability, particularly for protein and sports nutrition products. A customer who orders a flavour they have not tried before and finds it unpalatable upon receipt does not technically have grounds for a return in most D2C brand policies, but the delivery refusal on COD happens before policy can be applied.
Regulatory labelling compliance is a secondary risk. Supplements sold with unverified health claims generate higher returns and complaint rates when customers do not experience the promised outcome. This is a content and claims accuracy issue rather than an operations issue, but it manifests in the operations data as elevated return rates.
High-repeat-purchase rates in supplements, customers who find a product they use, re-order on subscription consistently, naturally compress RTO rates over time as the customer base matures. A brand’s Day 1 RTO rate is typically higher than its 18-month RTO rate as repeat customers (who have near-zero RTO) grow as a percentage of total orders.
RTO rates in India in the ecommerce 2026 benchmark for health supplements: 6-14% average; mature brands with high repeat rates 4-8%.
Category 6: Home Furnishings and Large-Format Products, RTO Rate: 10-25%
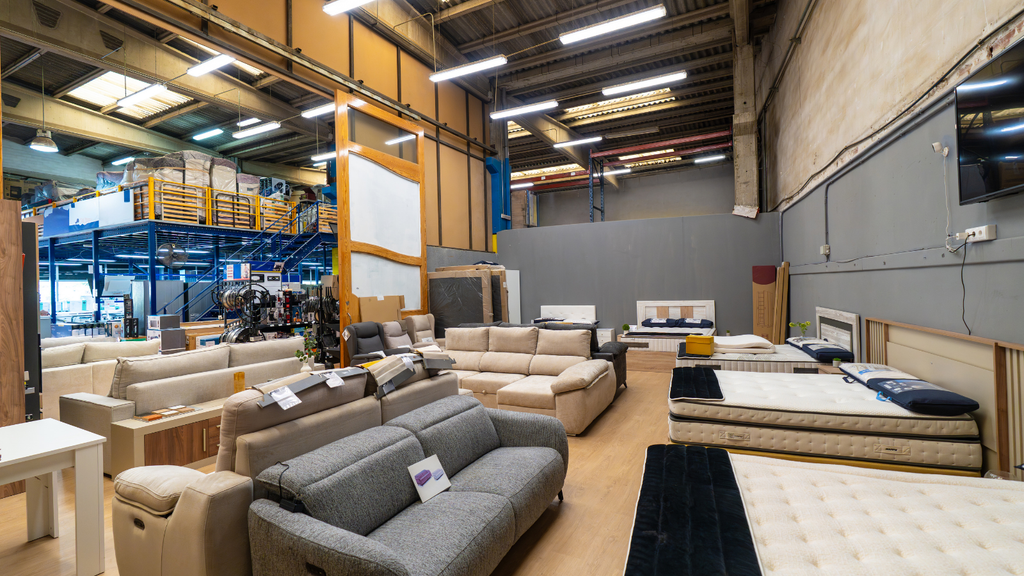
Home furnishings present a unique RTO profile driven by a failure mode that does not exist in most other categories: the product arrives and does not fit in the space, or assembly is more complex than expected, or the colour looks different from the product photography.
The large-format challenge compounds all of these drivers. A sofa that arrives and does not fit through the apartment door is a logistics event that costs the brand forward shipping, reverse shipping (at a higher weight-based cost than small parcels), and coordination overhead for scheduling a large-item pickup. Return shipments can make up to 20% of total shipments in eCommerce. This rate climbs to 40% in the case of COD orders.
The colour and dimension accuracy problem
Home decor and furniture purchases are highly dependent on the physical space context that online product photography cannot accurately convey. A customer who loved the walnut-finish bookshelf in the product photo discovers that in their living room under yellow light, the colour looks completely different. This expectation mismatch is the primary non-COD RTO driver in home furnishings.
Brands using AR (augmented reality) room visualisation, where customers can see a product in their own space using their phone camera, report meaningfully lower RTO rates than brands relying on standard product photography. Wakefit was among the early Indian D2C brands to invest in this technology, and the RTO reduction justification was precisely this expectation-mismatch problem.
RTO rates in India in the ecommerce 2026 benchmark for home furnishings: 10-25% average; brands with AR visualisation and COD management 8-15%. RTO rates in India in the ecommerce 2026 for large-format items can exceed 25% where COD is available on high-value pieces.
Category 7: Ethnic Wear and Occasion-Wear, RTO Rate: 30-45%
Ethnic wear deserves a separate category breakdown from general fashion because its RTO rate is structurally higher. The combination of sizing complexity, gifting use cases, and occasion-specific purchase intent creates a failure profile that significantly exceeds the already-high general fashion category.
Why ethnic wear RTO is the highest in Indian D2C
Ethnic wear sizing is not standardised across any dimension. A lehenga’s blouse size, skirt length, dupatta dimensions, and embroidery weight all vary by brand with no universal reference. A customer ordering a wedding outfit for a specific event has no ability to verify any of these dimensions without physically trying the product.
The gifting dimension adds another layer. A significant share of ethnic wear purchases are gifts, a saree for a mother, a kurta for a father, a lehenga for a sister. The gift-buyer orders based on their best estimate of the recipient’s size. The probability of an accurate size estimate for a gifted ethnic wear purchase is significantly lower than for a self-purchase. When the gift does not fit, the delivery may be refused, or the product may be returned after delivery.
The occasion-specificity of ethnic wear means a purchased product that does not arrive before the event becomes useless, regardless of fit. Late deliveries in this category generate refusals that would not occur in a time-neutral category.
RTO rates in India in the ecommerce 2026 benchmark for ethnic wear: 30-45% average; brands with occasion-delivery guarantees and virtual try-on 20-28%.
Category 8: Grocery and Perishables, RTO Rate: 2-8%
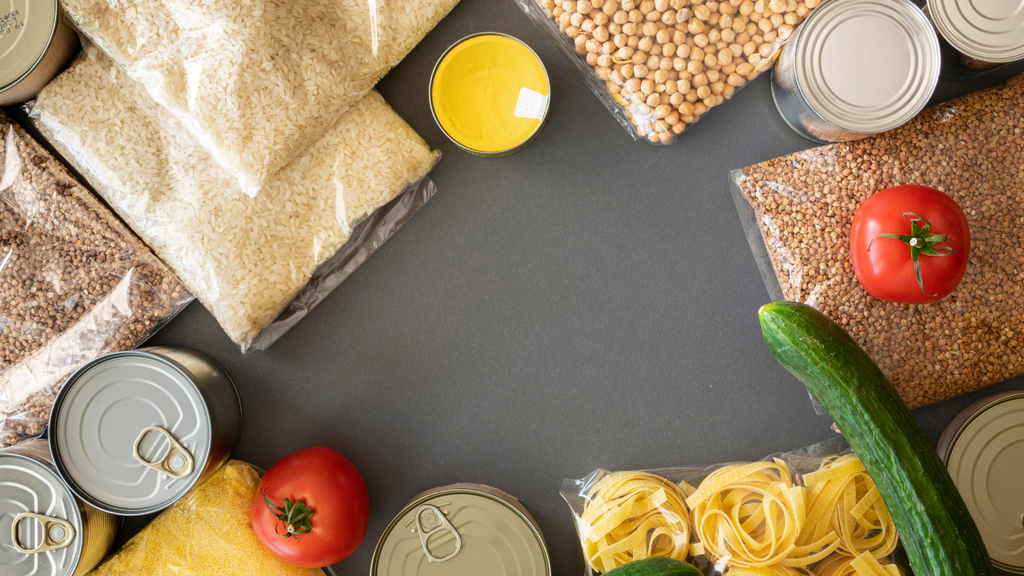
Grocery and perishables are the lowest-RTO category in Indian D2C, but for reasons that reveal important nuances about how category RTO rates in India in the ecommerce 2026 are shaped by business model as much as product type.
Why is grocery RTO structurally low?
Grocery purchases are need-based, not desire-based. A customer who ordered milk, vegetables, or packaged staples has a genuine, immediate need for those products. Refusing the delivery means going without something they actually need. The economic logic of refusing a grocery order is far weaker than refusing a fashion order.
Quick commerce now accounts for 70-75% of total e-grocery orders, compared to 35% in 2022. The shift to quick commerce for grocery deliveries has also reduced RTO, because a 10-30 minute delivery reaches the customer while they are still actively in the need state that triggered the order. A 4-day delivery for a grocery item may arrive after the need has already been met through alternate means.
Where grocery RTO does occur
The primary grocery RTO failure mode is quality disputes, a customer receives produce that is not fresh, a dairy product that is near expiry, or a packaged item that is damaged in transit. These are operations and quality control issues. Brands like Licious, Country Delight, and Milkbasket have built their operations around freshness SLAs, same-day or next-day delivery with FIFO/FEFO dispatch, specifically because freshness disputes are the primary RTO driver in their category.
RTO rates in India in the ecommerce 2026 benchmark for grocery and perishables: 2-8% average; quick commerce platforms 1-4%.
Category 9: Jewellery and Accessories, RTO Rate: 4-12%

Jewellery has a lower RTO rate than most consumer categories in India, driven by high purchase consideration, high emotional investment, and typically prepaid payment. Customers ordering ₹2,000-₹20,000 jewellery pieces rarely use COD. Jewellery sits as low as 4 percent for well-presented products.
The specific jewellery RTO drivers
The primary jewellery RTO failure mode is expectation mismatch on metal colour, stone clarity, and product size relative to photography. A necklace that looks substantial in a product photo against a white background may appear delicate and smaller when worn. This is a photography and presentation accuracy issue.
Brands that use models to show scale and natural lighting to show metal colour see lower RTO rates than brands using maximalist product photography that presents the product more impressively than it appears in reality.
High-value jewellery RTO is particularly damaging because the reverse logistics cost as a percentage of order value is lower, but the absolute cost is higher. A ₹15,000 fine jewellery return involves insurance, signature-on-delivery return logistics, and quality verification that a ₹500 fashion return does not require.
GoKwik 2026 data shows the average COD RTO rate in India is 20-25%. Jewellery sits well below this average because the category self-selects for prepaid-preferring, considered buyers who have much lower refusal rates.
RTO rates in India in the ecommerce 2026 benchmark for jewellery: 4-12% average; fine jewellery with OTP delivery 3-6%.
Category 10: Sports, Fitness and Activewear, RTO Rate: 15-28%
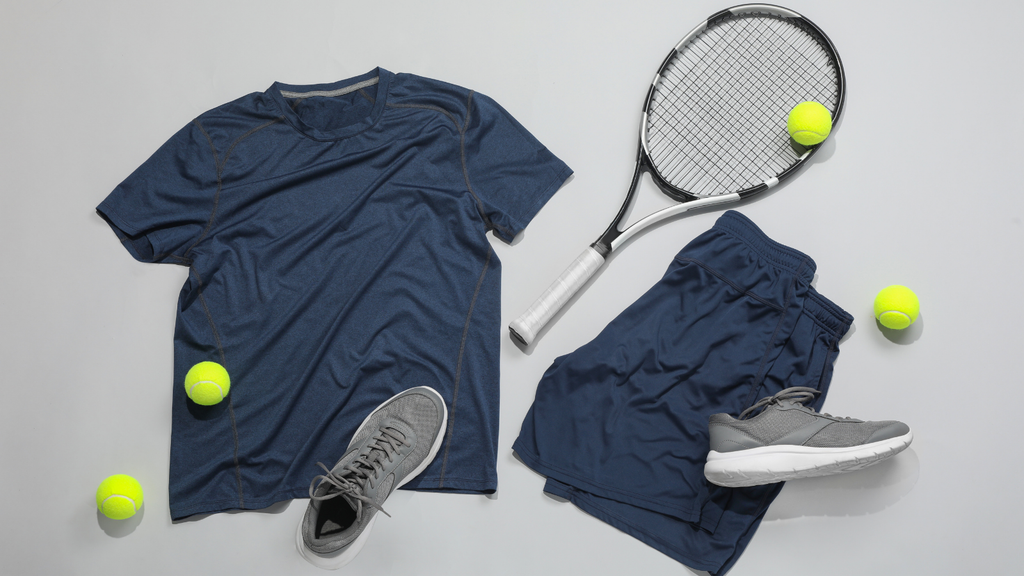
Sports and fitness wear sits between general fashion and beauty in its RTO profile. The category has a sizing problem similar to fashion; activewear sizing varies significantly by brand and fit preference (compression vs. relaxed, cropped vs. full-length), but a higher purchase intent than mass-market fashion because buyers are typically shopping for functional performance requirements rather than style alone.
What drives activewear RTO specifically
The fabric expectation problem is specific to activewear. A customer who orders leggings based on “4-way stretch” marketing may receive a product that stretches less than expected in their actual use case; a yoga brand’s interpretation of stretch differs from a running brand’s. This is a product description accuracy problem.
The fit complexity in activewear is also compounded by body-type variation. Standard S/M/L sizing in activewear fits very differently across Indian body types than the brand’s size chart may indicate. Brands that include model measurements alongside size charts and show products on multiple body types report lower RTO rates from fit-related refusals.
Sports equipment D2C products like resistance bands, yoga mats, and kettlebells have significantly lower RTO rates than activewear, sitting closer to the electronics profile (8-15%), because size and fit are not relevant failure modes.
RTO rates in India in the ecommerce 2026 benchmark for sports and activewear: 15-28% average; brands with detailed fit guides and IVR verification 10-18%. Understanding RTO rates in India in the ecommerce 2026 across the sports category requires separating apparel from equipment, as they operate on entirely different return profiles.
Category 11: Pet Care Products, RTO Rate: 8-18%
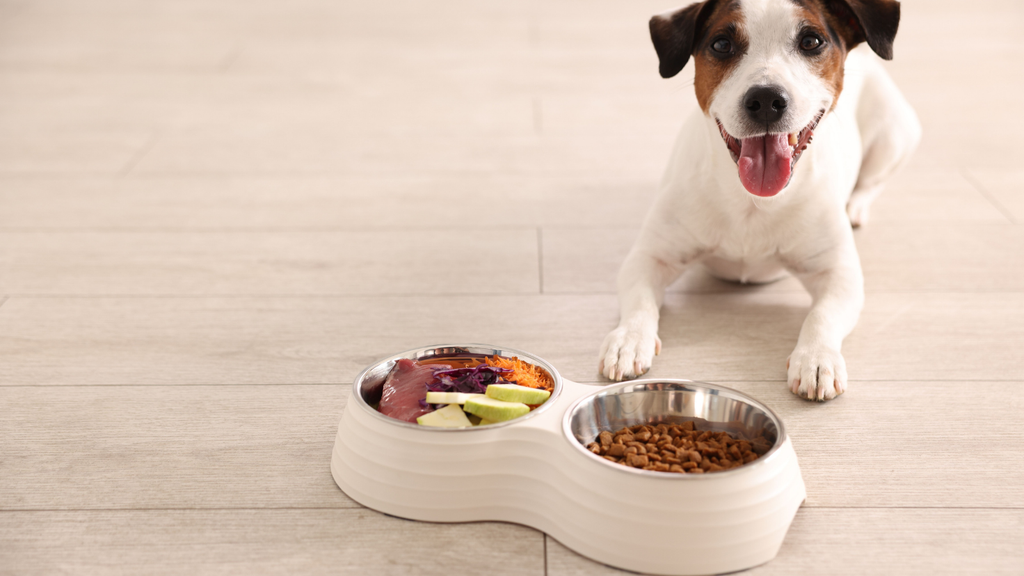
Pet care is an emerging D2C category in India with a distinctive RTO profile. The category benefits from high emotional investment (pet owners treat purchases for their pets as high-consideration decisions) and relatively low COD prevalence (pet care customers skew toward urban, digitally-fluent buyers who prefer prepaid).
The specific pet care RTO challenge
The primary RTO failure mode in pet care is the variant accuracy problem, particularly for pet food, where the wrong protein source, wrong life stage (puppy vs. adult), or wrong bag size creates a return. A dog food order for an 8-week puppy that arrives as an adult formulation is a legitimate quality issue. A harness ordered in size S for a 5kg dog that arrives in size M is a pick-and-pack error.
Brands like Heads Up for Tails, Supertails, and Wiggles have built their operations around variant-level precision because in this category, a wrong-variant dispatch is not just an inconvenience; it is a safety concern for the animal. This safety dimension gives pet care D2C brands higher operational motivation to invest in scan-based picking validation than equivalent investments in lower-stakes categories.
RTO rates in India in the ecommerce 2026 benchmark for pet care: 8-18% average; brands with barcode scan picking 5-10%.
Category 12: Home Care and Cleaning, RTO Rate: 5-12%

Home care products, detergents, surface cleaners, dishwashers, and air fresheners share the low-RTO profile of grocery and personal care. Products in this category are consumable necessities with no fit variable, purchased with clear functional intent, and typically at low enough price points that COD refusal psychology does not apply strongly.
What creates the non-zero RTO rate
Damaged-in-transit is the primary home care RTO driver. Liquid products in packaging that is not adequately protected can leak during transit, arriving damaged or partially empty. This is a packaging and logistics quality issue that the best home care D2C brands address through reinforced packaging specifications rather than courier management.
Product concentration disputes are a secondary driver. A customer who expected a “concentrated” cleaner to produce more value per litre than a standard cleaner, based on marketing framing, and found it performed similarly, may initiate a return. Accurate product claims and honest concentration disclosures reduce this category of expectation mismatch.
RTO rates in India in the ecommerce 2026 benchmark for home care: 5-12% average; brands with robust transit packaging 3-7%.
The RTO Rate Summary: All 12 Categories Side by Side
Understanding RTO rates in India in the ecommerce 2026 requires looking at all categories simultaneously, because the operational decisions that are rational for one category may be wrong for another.
| Category | Average RTO Rate | Top Performer Rate | Primary Driver |
| Ethnic Wear | 30-45% | 20-28% | Sizing, gifting, occasion-specificity |
| Fashion and Apparel | 25-40% | 12-18% | Fit, impulse, bracketing |
| Footwear | 20-35% | 12-20% | Sizing, fit uncertainty |
| Sports and Activewear | 15-28% | 10-18% | Fit, fabric expectation |
| Electronics and Gadgets | 8-18% | 6-10% | Variant error, expectation mismatch |
| Home Furnishings | 10-25% | 8-15% | Space fit, colour mismatch |
| Pet Care | 8-18% | 5-10% | Variant accuracy, size |
| Health Supplements | 6-14% | 4-8% | Flavour mismatch, claims |
| Beauty and Personal Care | 5-15% | 3-8% | Expiry, expectation mismatch |
| Home Care and Cleaning | 5-12% | 3-7% | Transit damage, claims |
| Jewellery and Accessories | 4-12% | 3-6% | Size, photography accuracy |
| Grocery and Perishables | 2-8% | 1-4% | Freshness, quality |
What Moves RTO Rates Across Every Category
The average COD RTO rate in India is 20-25%. Successful COD order cost: ₹200 on a ₹1,000 order (20% operational cost). RTO order loss: ₹285 (₹200 direct + ₹85 reverse logistics). Margin impact per RTO: 40% reduction in selling price recovered as loss.
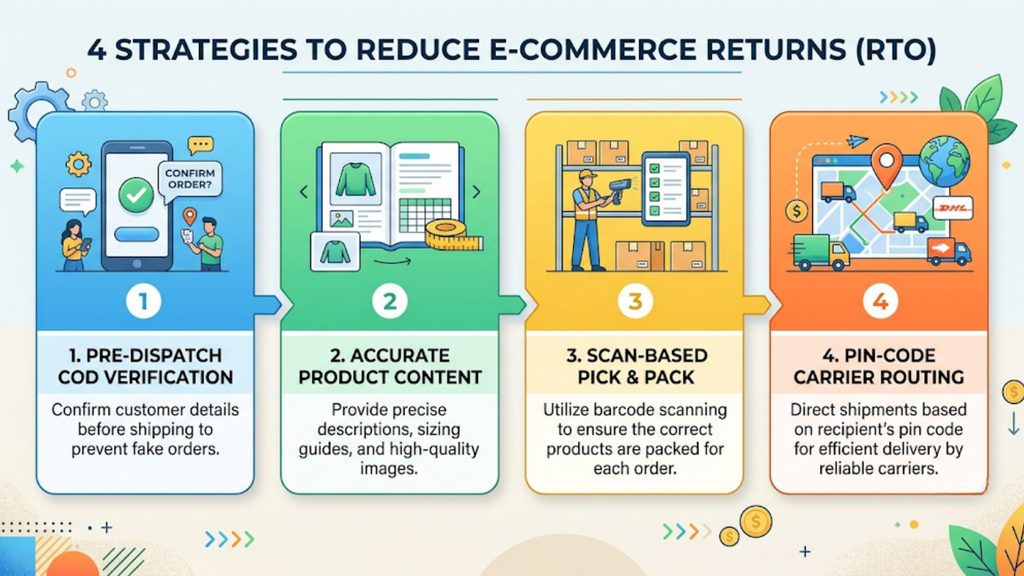
Despite category-level variation, four operational interventions move RTO rates across all categories without exception. These are the levers that explain why top performers in every category above sit 10-15 percentage points below the category average on RTO rates in India in the ecommerce 2026.
- Pre-dispatch COD verification. Average RTO rates hover at 28-35% for COD transactions compared to 4-8% for prepaid orders. Each returned COD order costs brands ₹180-240 in forward shipping, reverse logistics, and processing overhead. Automated IVR or WhatsApp verification within 5 minutes of a COD order being placed filters out low-intent and non-deliverable orders before a single rupee of fulfilment cost is spent.
- Accurate product content. The expectation mismatch class of RTO, across fashion, electronics, home furnishings, and supplements, is almost entirely driven by product descriptions and photography that set expectations the product cannot meet. Brands that invest in honest, accurate, measurement-based product content see structural RTO improvement that no logistics intervention can replicate.
- Scan-based pick and pack validation. Wrong-variant fulfilment is an operational error, not a customer behaviour problem. Every wrong-variant dispatch generates a return. Barcode scan validation at the packing stage, where a mismatch triggers an alert before the parcel is sealed, eliminates this failure class. Base.com’s Pick and Pack Assistant implements this validation at every packing station.
- Pin-code-level carrier routing. A Tier-2 city showing 38% overall RTO might contain neighbourhoods with 12% return rates alongside areas hitting 61%. Blanket COD removal punishes high-intent customers sharing postal codes with problematic addresses. Carrier selection based on historical per-pin-code delivery performance, rather than a single default carrier, is the last-mile logistics equivalent of the other three interventions.
How Base.com Addresses the Operational Root Causes of RTO
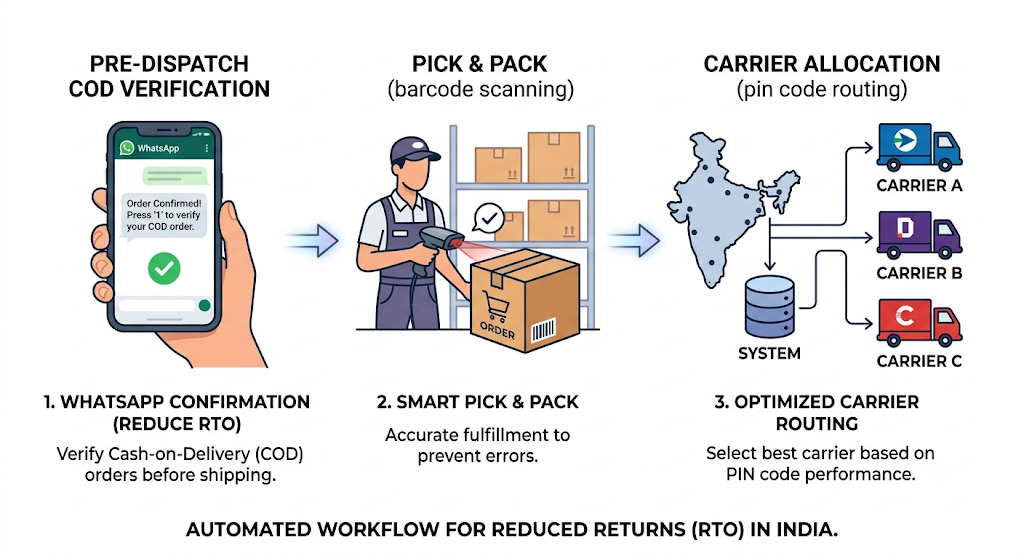
The category-level RTO rates in India in the ecommerce 2026 share a common operational root cause despite their different surface-level drivers. (KW #16) Most are preventable through the same operational infrastructure.
Base.com’s Workflow Automation module automates pre-dispatch COD verification workflows, triggering WhatsApp or SMS confirmations when a COD order is placed, before shipping is created.
Base.com’s Pick and Pack Assistant validates every item at the packing station using barcode scanning, eliminating wrong-variant fulfilment. Base.com’s Shipping Management module allows carrier allocation rules to be configured by pin code, order value, and COD flag, routing each order to the carrier with the best historical delivery performance for that specific destination.
The WMS module’s returns management handles the reverse side, structured intake, quality check, and immediate inventory restock for accepted returns, so the working capital impact of returns is minimised even when an RTO occurs.
No single technology intervention eliminates RTO. But the combination of pre-dispatch verification, scan-based picking, and intelligent carrier routing consistently moves brands from the category average to the top performer range across all 12 categories reviewed here.
The Bottom Line on RTO rates in India in the ecommerce 2026
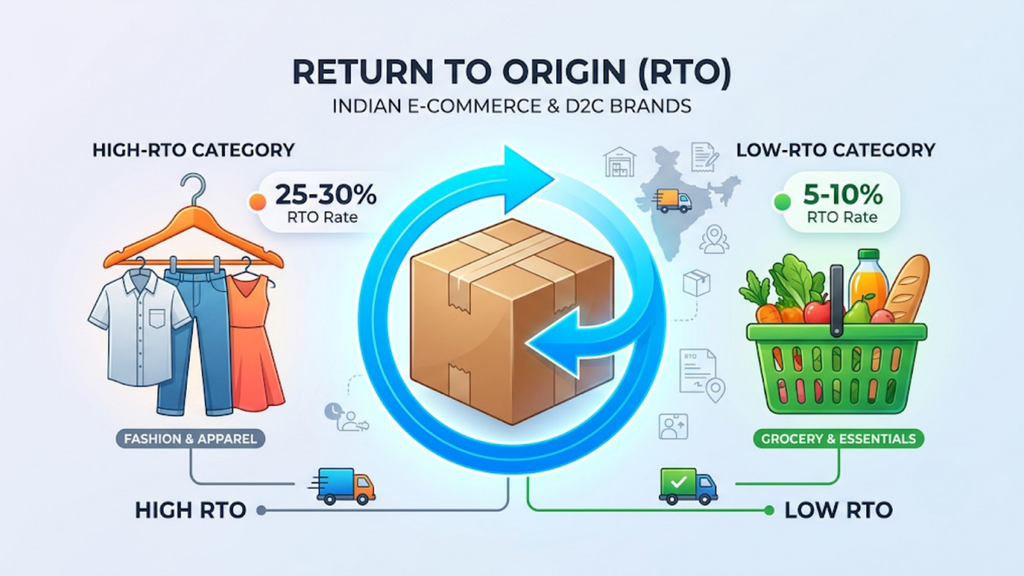
Every year, Indian D2C brands collectively lose over ₹8,000 crore to Return to Origin. That figure is not distributed evenly across categories. The ethnic wear, fashion, and footwear categories contribute a disproportionate share of that ₹8,000 crore. The grocery and jewellery categories contribute a small fraction.
The operational implication is precise: a fashion brand and a grocery brand need completely different RTO reduction strategies, different courier allocation priorities, different pre-dispatch verification intensity, and different content investment levels. Applying a one-size-fits-all RTO reduction playbook, or worse, benchmarking against the national average rather than the category average, produces the wrong operational decisions.
The category-level benchmarks in this analysis give brands the reference point they need to answer one simple question: Is your brand at the category average, or is it at the top performer range? RTO rates in India in the ecommerce 2026 show consistently that the gap between average and top performer is 10-15 percentage points across every category, and that gap is operational, not structural. The brands closing it are the ones building the operational infrastructure to prevent the failure modes that drive RTO in their specific category.
RTO rates in India in the ecommerce 2026 will continue to be a defining profitability variable for Indian D2C brands as COD volume grows with Tier 2 and Tier 3 market expansion. The brands that understand the category-level drivers and build category-specific operational responses will compound the margin advantage of lower RTO into the competitive moat that separates them from brands still treating RTO as an unavoidable cost of doing business in India.