

To calculate a profitable sale price, subtract every variable cost from the price: COGS, marketplace fees, fulfilment, payment handling, returns, and allocated ad spend, and confirm what remains covers your fixed cost share. Gross margin is not profit. Contribution margin after acquisition cost is the number that decides.
A SKU at 65% gross margin can lose money on every unit sold. This guide shows exactly how.
Why Gross Margin Misleads When You Calculate Profitable Sale Price for Ecommerce Products
Gross margin subtracts only COGS. In marketplace selling, COGS is frequently less than half of the cost stack.
Benchmark analysis of public DTC brands puts median gross margin at 47%, with apparel and beauty above 55% and food and beverage below 35%. Those same public brands operate at a median operating margin of −2.4%, with only 4 of 14 clearing 5% EBITDA in FY2025.
Healthy gross margins, negative operating margins. The gap between the two is where every cost that gross margin ignores actually lives.
The pressure has intensified. Median DTC contribution margin reportedly shrank from 35% in 2021 to 22% in 2025 as paid acquisition became more expensive. Average ecommerce CAC has risen 40-60% since 2021. One 2026 benchmark report found ROAS fell roughly 9% across cohorts during 2025 while fixed marketing costs rose roughly 32%.
A necessary caveat before going further: almost all published unit-economics benchmarks are US and European, quoted in dollars, drawn from Shopify-heavy or SEC-filing samples. Indian marketplace economics differ substantially: lower AOVs, higher RTO, different fee structures. Use the benchmarks below to understand the shape of a healthy business, then build your own numbers. Where an Indian figure is available, this guide says so.
Learning how to calculate a profitable sale price for ecommerce products starts with abandoning gross margin as a decision metric.
The Profit Waterfall Behind How to Calculate Profitable Sale Price for Ecommerce Products
| Layer | What it subtracts | What it tells you |
|---|---|---|
| Gross margin | COGS only | Whether the product is worth making |
| CM1 | + marketplace fees, fulfilment, payment, returns | Whether the unit is worth selling |
| CM2 | + acquisition cost | Whether the sale is worth buying |
| CM3 | + variable overhead | Whether the operation is worth running |
| Net margin | + fixed costs, tax, interest | Whether the business works |
Most Indian sellers manage at gross margin and discover CM2 at year-end. Anyone serious about how to calculate a profitable sale price for ecommerce products works at CM1 and CM2 instead.
The layer that matters most for a sale price decision is CM1, because it is the cleanest measure of whether the unit itself carries its own cost. CM2 then tells you whether you can afford to advertise it.
Step by Step: How to Calculate Profitable Sale Price for Ecommerce Products
Work per SKU per channel. Averaging across SKUs hides the losers behind the winners, and averaging across channels hides that Amazon contribution typically runs 6-12 points lower than DTC because of the referral and FBA fee stack.
Step 1: List Every Variable Cost
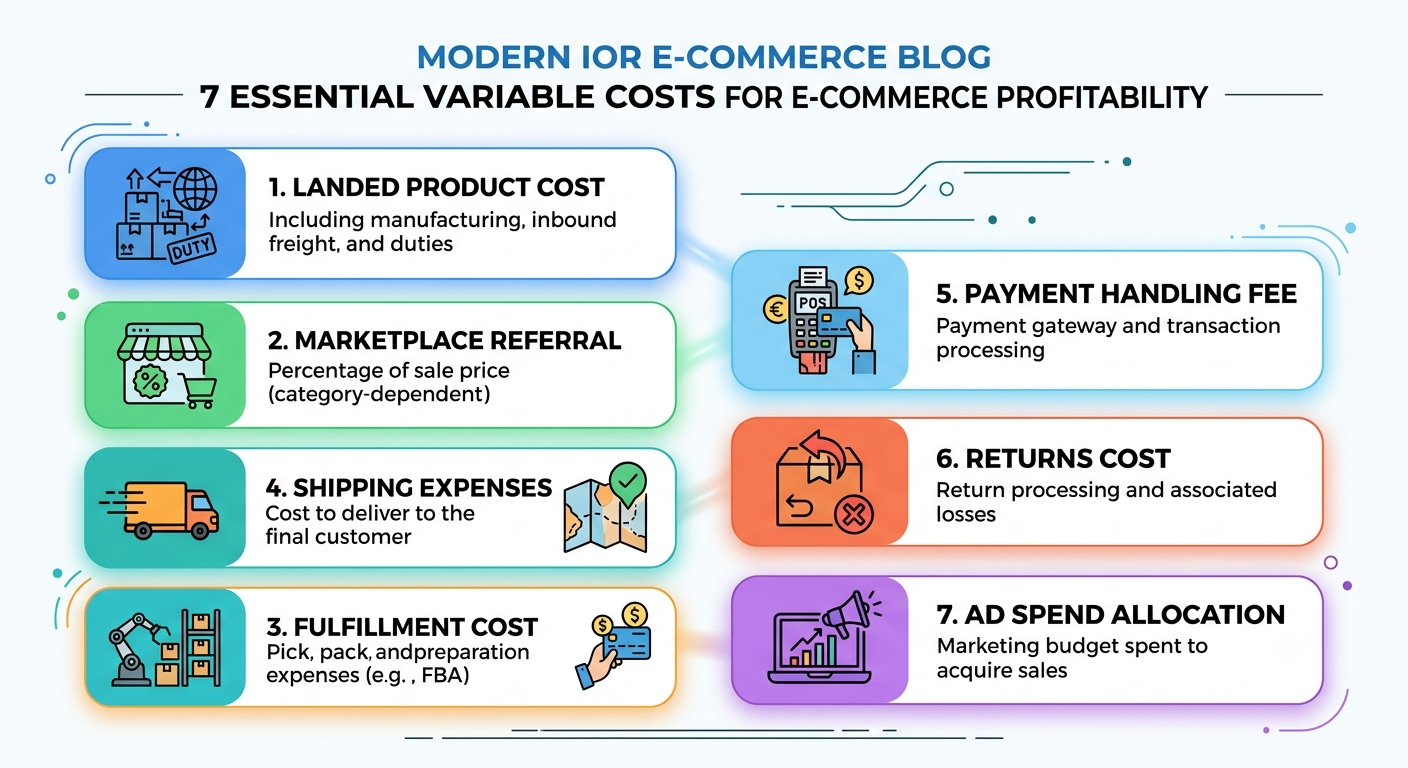
The completeness of this list determines whether the rest of how to calculate a profitable sale price for ecommerce products produces a real number or a comfortable one.
- COGS: landed product cost including inbound freight and duties.
- Marketplace referral fee: percentage of sale price, category-dependent.
- Fulfilment cost: FBA, Flipkart Fulfilment, or your own pick-pack-ship cost.
- Shipping: commonly 8-12% of revenue in benchmark analysis, and fulfilment costs have risen 15-25% since 2022.
- Payment handling: gateway charges on prepaid, COD handling charges on cash orders.
- Returns cost: the line most often omitted entirely.
- Ad spend allocation: ad spend consumes 20-35% of DTC revenue in benchmark data.
Step 2: Calculate Expected Returns Cost Properly
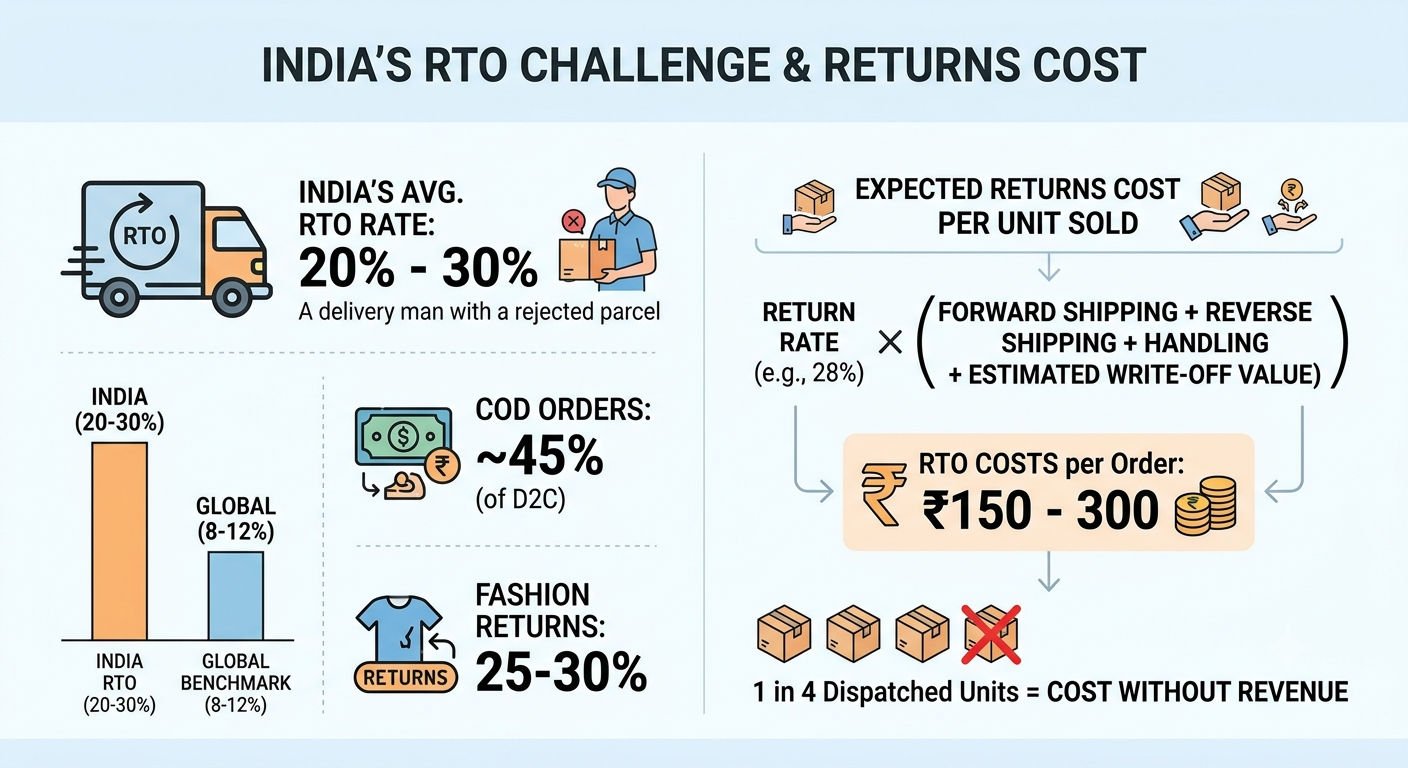
This is where Indian calculations diverge most from Western templates.
India’s average RTO rate sits between 20% and 30%, against a global benchmark closer to 8-12%, with COD around 45% of D2C orders and fashion returns commonly reported at 25-30%. RTO costs are frequently cited at ₹150-300 per order. These are vendor and industry-survey figures rather than a single authoritative study, directional and worth replacing with your own courier data.
Expected returns cost per unit sold = return rate × (forward shipping + reverse shipping + handling + expected write-off value)
At a 28% return rate, roughly one in four dispatched units generates cost without revenue. That is not a footnote in the calculation. It is often the second-largest line after COGS.
Step 3: Build the Waterfall for One SKU
A worked example on a ₹1,499 fashion SKU sold on a marketplace:
| Line | Amount | % of price |
|---|---|---|
| Sale price | ₹1,499 | 100% |
| COGS | −₹525 | 35% |
| Gross margin | ₹974 | 65% |
| Marketplace referral fee | −₹225 | 15% |
| Fulfilment and shipping | −₹90 | 6% |
| Payment / COD handling | −₹45 | 3% |
| Expected returns cost | −₹210 | 14% |
| CM1 | ₹404 | 27% |
| Allocated ad spend | −₹270 | 18% |
| CM2 | ₹134 | 8.9% |
| Variable overhead | −₹75 | 5% |
| CM3 | ₹59 | 3.9% |
A SKU showing 65% gross margin delivers 3.9% at CM3. Nothing in that table is unusual. Every line is a normal cost.
Cost percentages are illustrative and should be replaced with your own. The structure is the point.
Step 4: Stress-Test the Discounted Price
Now apply a 25% sale discount to the same SKU. Price falls to ₹1,124.
| Line | Amount |
|---|---|
| Sale price | ₹1,124 |
| COGS | −₹525 |
| Marketplace referral fee (15%) | −₹169 |
| Fulfilment and shipping | −₹90 |
| Payment / COD handling (3%) | −₹34 |
| Expected returns cost | −₹210 |
| CM1 | ₹96 (8.5%) |
| Allocated ad spend | −₹270 |
| CM2 | −₹174 |
CM1 collapsed from 27% to 8.5%. CM2 went negative. Every advertised unit now loses ₹174.
Notice which costs did not fall with the price: COGS, fulfilment, and returns are per-unit costs that are indifferent to your discount. Only the percentage-based fees shrank.
This is the entire argument for why anyone deciding how to calculate a profitable sale price for ecommerce products must run the discounted case, not the list-price case.
Step 5: Derive Your Break-Even ROAS
This is the step that connects how to calculate profitable sale price for ecommerce products to your advertising decisions.
Break-even ROAS = 1 ÷ contribution margin
This relationship is arithmetic, and it is the single most useful line in the whole framework. A 20%-margin brand needs 5.0x to break even. A 50%-margin brand breaks even at 2.0x.
For the SKU above at full price, CM1 of 27% gives a break-even ROAS of 3.7x. At the discounted price, CM1 of 8.5% gives a break-even ROAS of 11.8x.
Industry average ROAS was around 2.87x in 2025, with half of stores below 2x. An 11.8x requirement is not achievable in any normal advertising environment. The discounted SKU cannot be advertised profitably, which means it can only work as an organic-traffic or deal-slot play.
Step 6: Set the Floor and Hold It
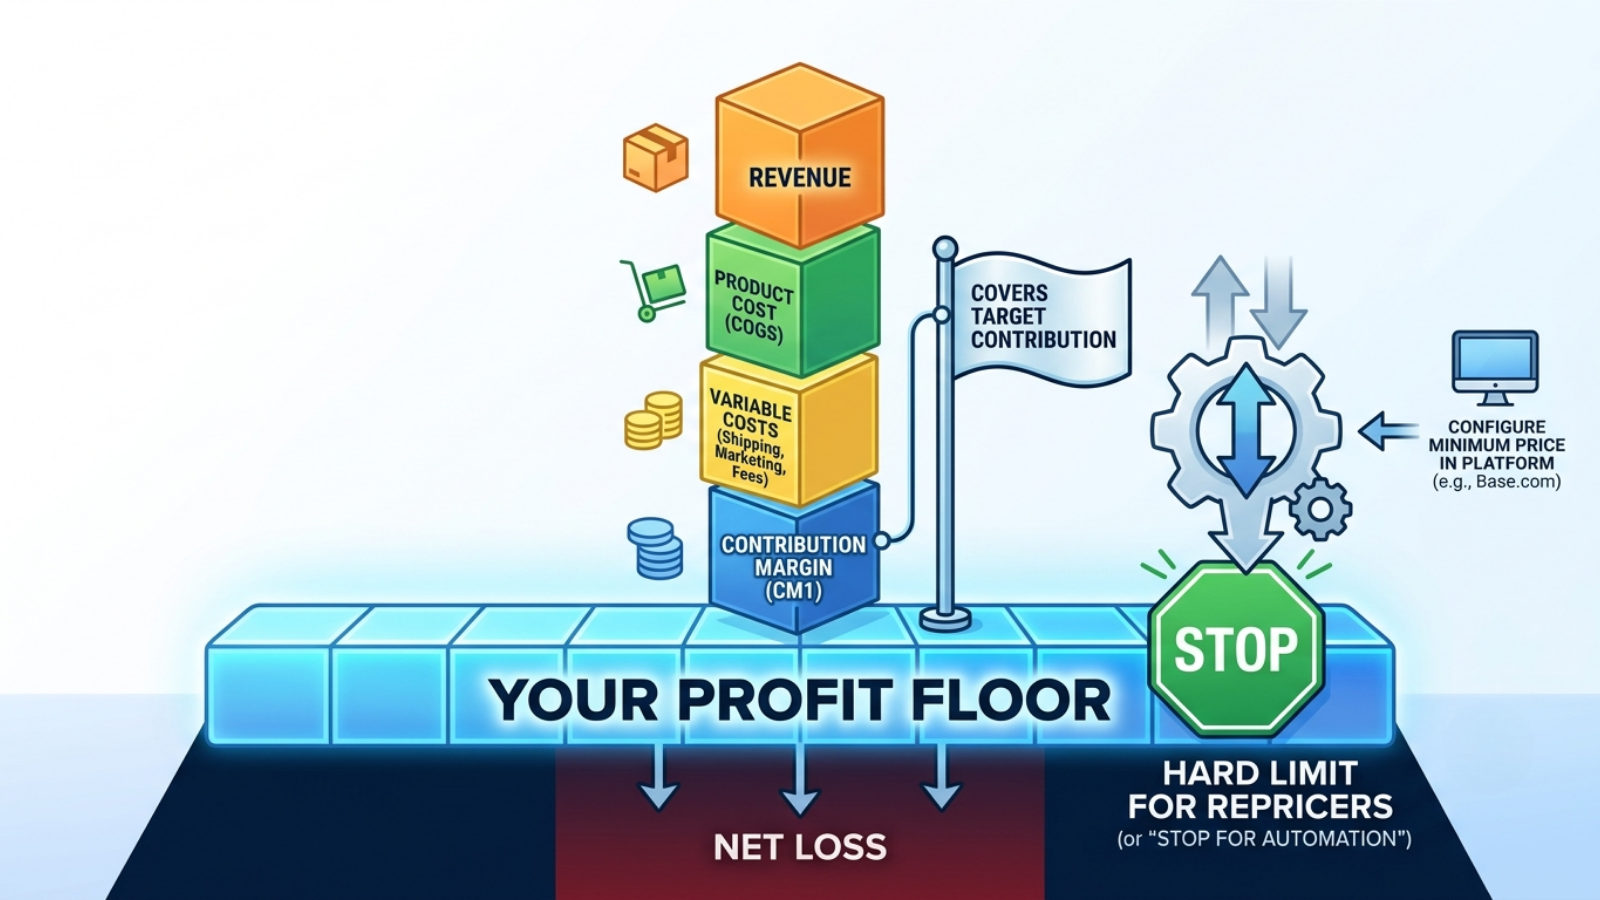
Everything in how to calculate a profitable sale price for ecommerce products converges on a single enforceable number.
Your floor is the price at which CM1 still covers your target contribution.
Write it into your pricing system as a hard limit rather than a guideline, and configure any repricing automation to treat it as the stop. Platforms including Base.com allow a defined minimum below which automated price adjustment will not go, with configurable behaviour when the calculated price would breach it.
Top Metrics That Prove Profitability: Industry Standards and How to Achieve Them
This is the measurement set that tells you whether how to calculate a profitable sale price for ecommerce products was applied correctly. For each: what it is, the published standard, and how to move it.
1. Contribution Margin (CM1)
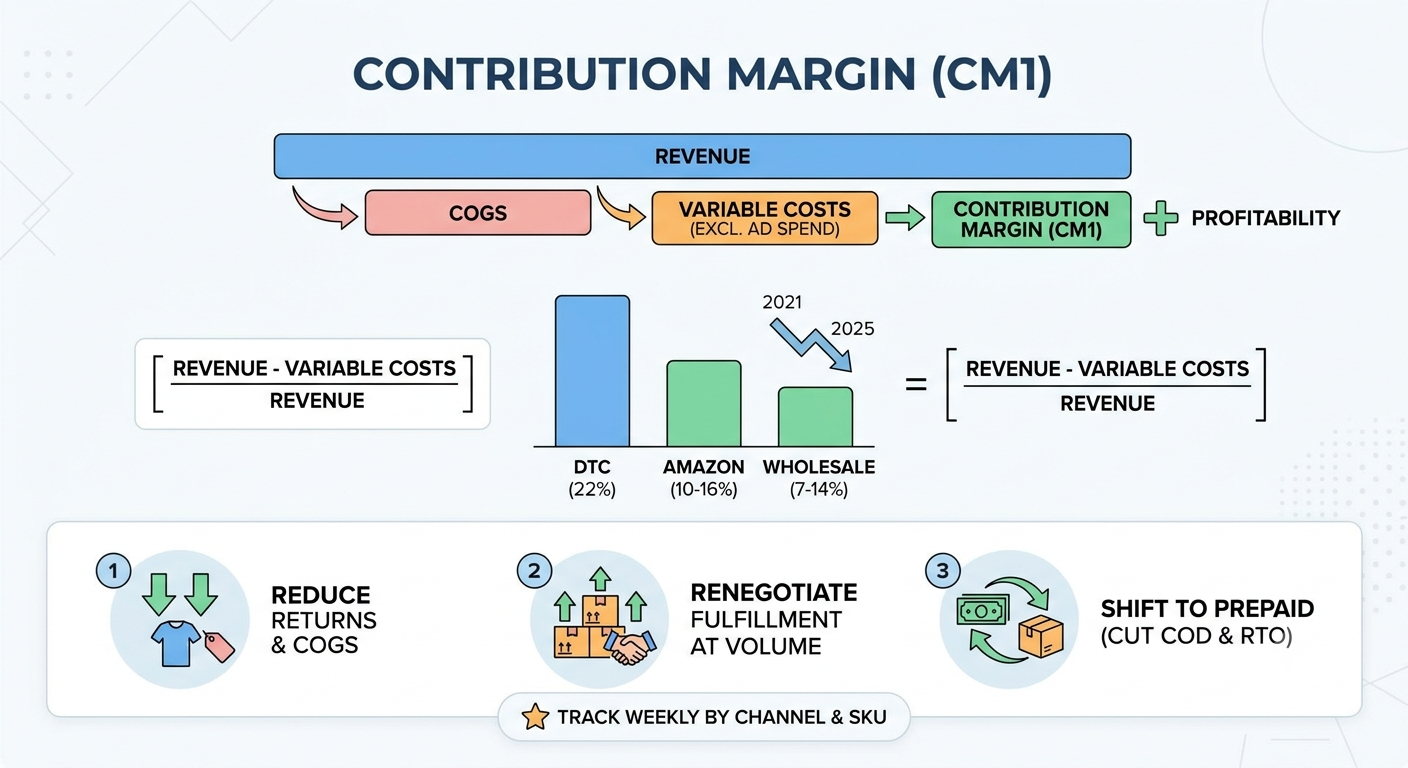
Formula: (Revenue − all variable costs excluding ad spend) ÷ Revenue
Industry standard: Median DTC contribution margin reportedly fell from 35% in 2021 to 22% in 2025. Amazon contribution typically runs 6-12 points below DTC; wholesale 8-15 points below.
How to improve it: Reduce returns before reducing COGS; in fashion, the returns line frequently exceeds the negotiable portion of product cost. Renegotiate fulfilment tiers at volume. Shift mix toward prepaid to cut COD handling and RTO simultaneously.
Track it weekly, by channel and by SKU. A blended figure drives no decisions. Weekly cadence matters because contribution moves with fee changes, courier rate revisions and return-rate drift, none of which announce themselves.
If you track only one metric from this entire list, track this one. It is the closest single number to whether how to calculate profitable sale price for ecommerce products was done correctly, and it responds to almost every operational lever you control.
2. Break-Even ROAS
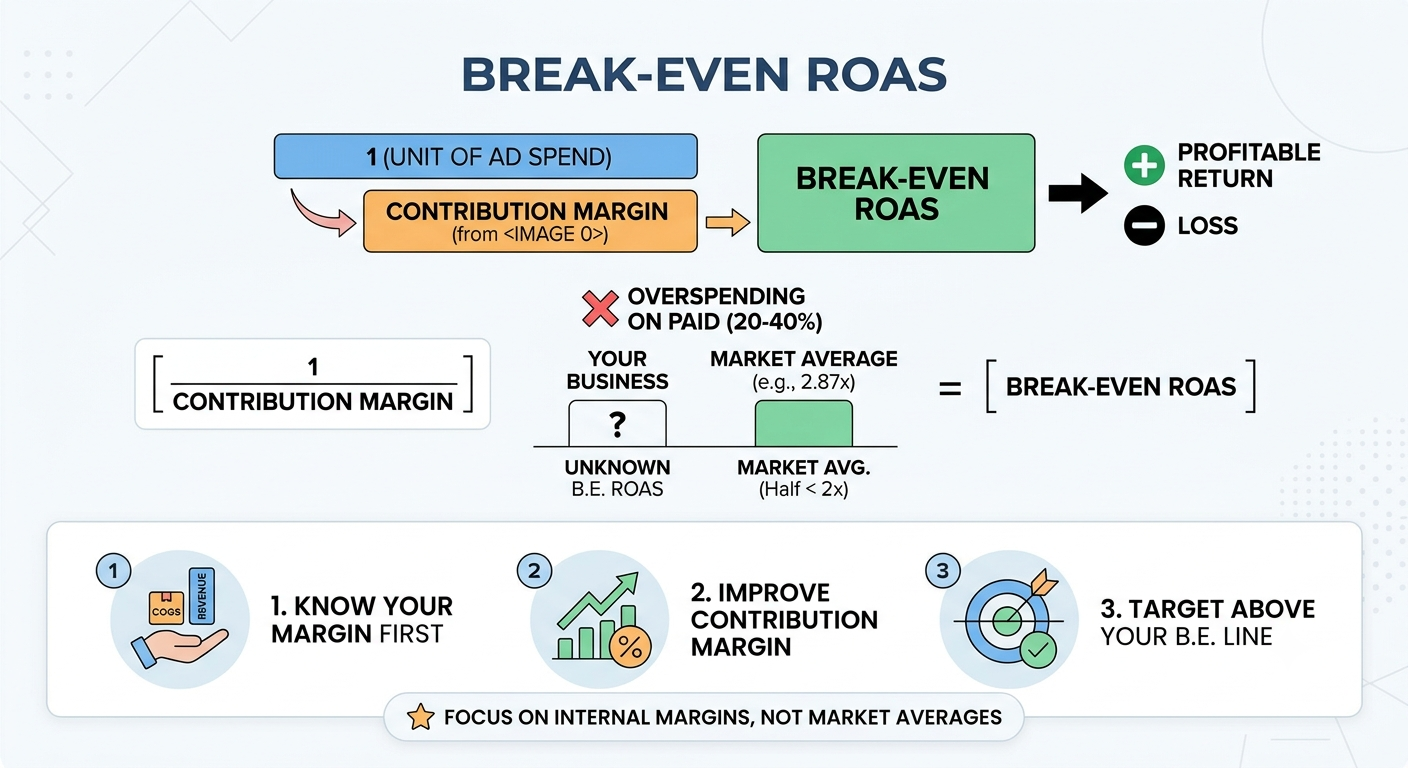
Formula: 1 ÷ contribution margin
Industry standard: Average ROAS around 2.87x in 2025, with half of stores below 2x. Brands measuring only platform-reported ROAS reportedly overspend on paid by 20-40%.
How to improve it: The only real lever is contribution margin. Break-even ROAS is a margin question in disguise, which is why chasing a “good ROAS” number without knowing your own break-even line is meaningless.
3. LTV: CAC Ratio

Formula: Customer lifetime value ÷ customer acquisition cost
Industry standard: 3:1 to 5:1 is the healthy band for most D2C categories. Below 2:1, the model is broken. Above 5:1 often signals under-investment; you could profitably spend more. Measure LTV on a 24-month lifetime.
How to improve it: Raise repeat rate before cutting CAC. A rising CAC is acceptable if LTV rises with it, which is why the ratio matters more than either number alone.
4. CAC Payback Period
Formula: Months until cumulative contribution from a customer covers their acquisition cost
Industry standard: Top quartile payback is 8 months; bottom quartile takes 18+ months.
How to improve it: Payback is where a 3:1 LTV: CAC can still be cash-trapped. Front-load contribution through higher first-order AOV, bundles, or subscription conversion rather than waiting for lifetime value to arrive.
5. Gross Margin

Formula: (Revenue − COGS) ÷ Revenue
Industry standard: Median 47% for public DTC; apparel and beauty above 55%; food and beverage below 35%. Premium DTC targets run higher, with mass-market or commodity products typically 10-20 percentage points lower.
How to improve it: Volume-tier negotiation, packaging cost reduction, and mix shift toward higher-margin SKUs. Useful as a screening metric, never as a profit metric.
6. Net Profit Margin
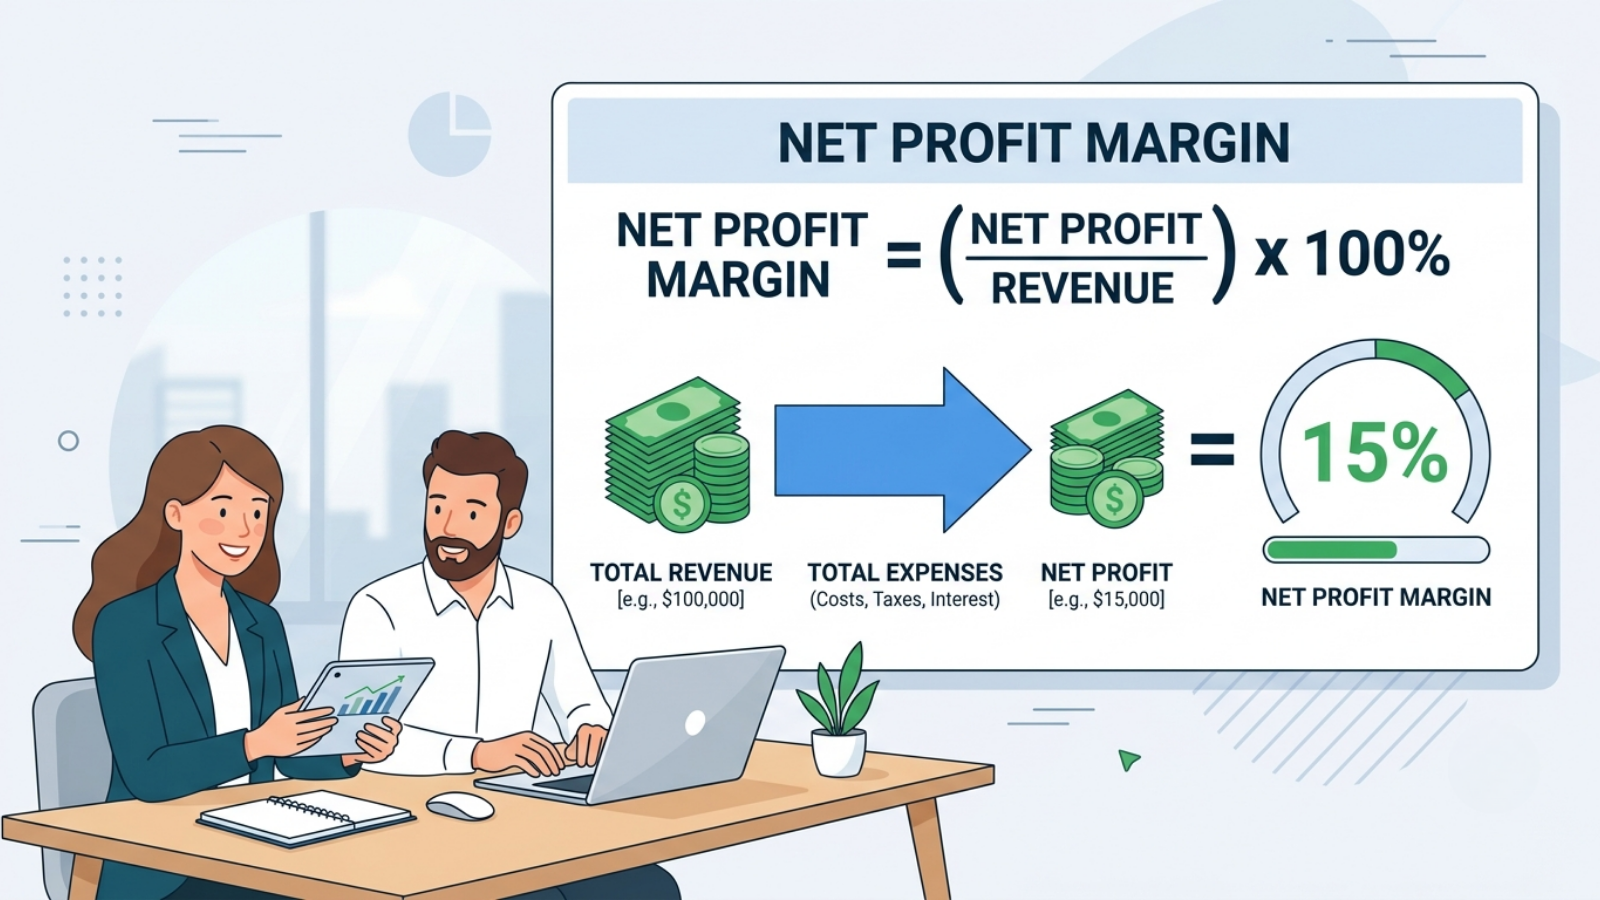
Formula: Net profit ÷ Revenue
Industry standard: Public DTC net margin medians of 2-8%, with leaders at 14%+. Broader DTC medians reported at 3-10% for 2026, with the $10-50M cohort facing the steepest compression.
How to improve it: By the time you are optimising net margin, the decisions were made upstream at CM1 and CM2. Net margin is a scoreboard, not a lever.
7. Inventory Turnover

Formula: COGS ÷ average inventory value
Industry standard: Ranges from 1.8x in beauty to 4.2x in food; apparel sits at 2.4x.
How to improve it: Cut the long tail. Slow SKUs consume working capital and warehouse space that faster SKUs would convert. Turnover is a profitability metric because it determines how many times a year your capital earns its margin.
8. Return Rate

Formula: Returned units ÷ dispatched units (state whether you count units, orders, or revenue; the three give different answers)
Industry standard: India’s national average is commonly reported at 15-20%, fashion at 25-30%, electronics at 5-8%, beauty at 1-5%. Global NRF benchmarks put overall ecommerce returns near 19-20%.
How to improve it: Better size guidance and imagery in fashion. Prepaid incentives to cut COD-driven RTO. Faster delivery, since delivery time correlates with cancellation and refusal.
Also fix the definition before you fix the number. A return rate counted on units, on orders, and on revenue produces three different figures for the same business, and teams frequently compare their orders-based number against a benchmark computed on units. Pick one definition, document it, and use it consistently.
9. Contribution Per Order
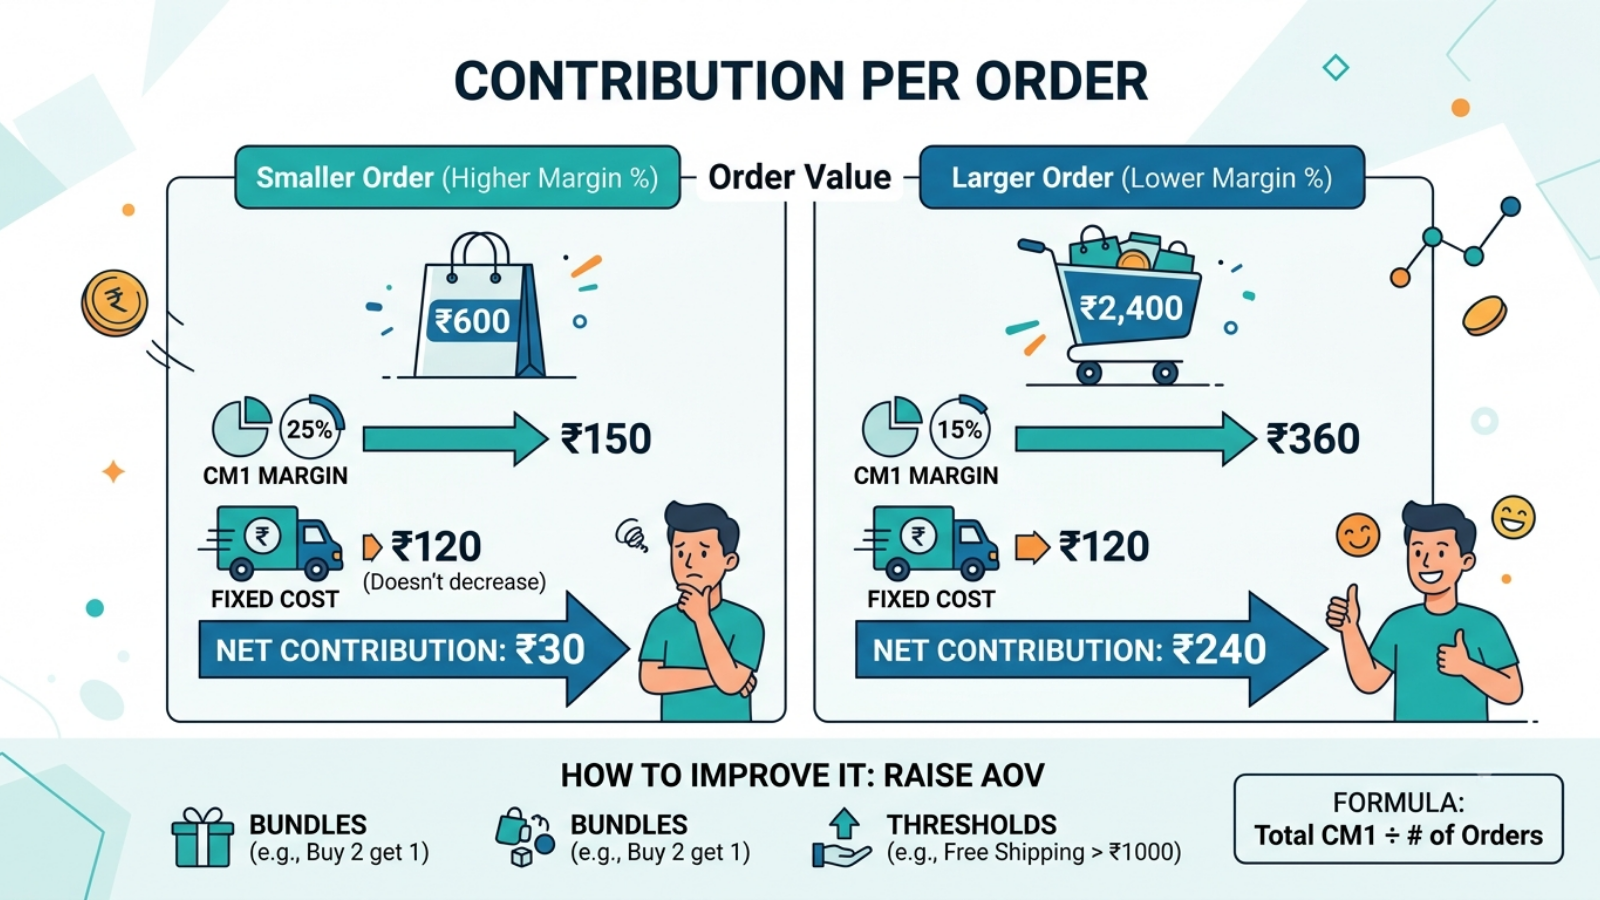
Formula: CM1 in rupees ÷ number of orders
Why it matters: Percentage margins hide the effect of AOV. A 25% margin on ₹600 is ₹150; on ₹2,400 it is ₹600. Your fixed cost per order does not scale down with basket size.
How to improve it: Raise AOV through bundles and thresholds rather than chasing percentage margin alone.
10. Marketing Cost Ratio
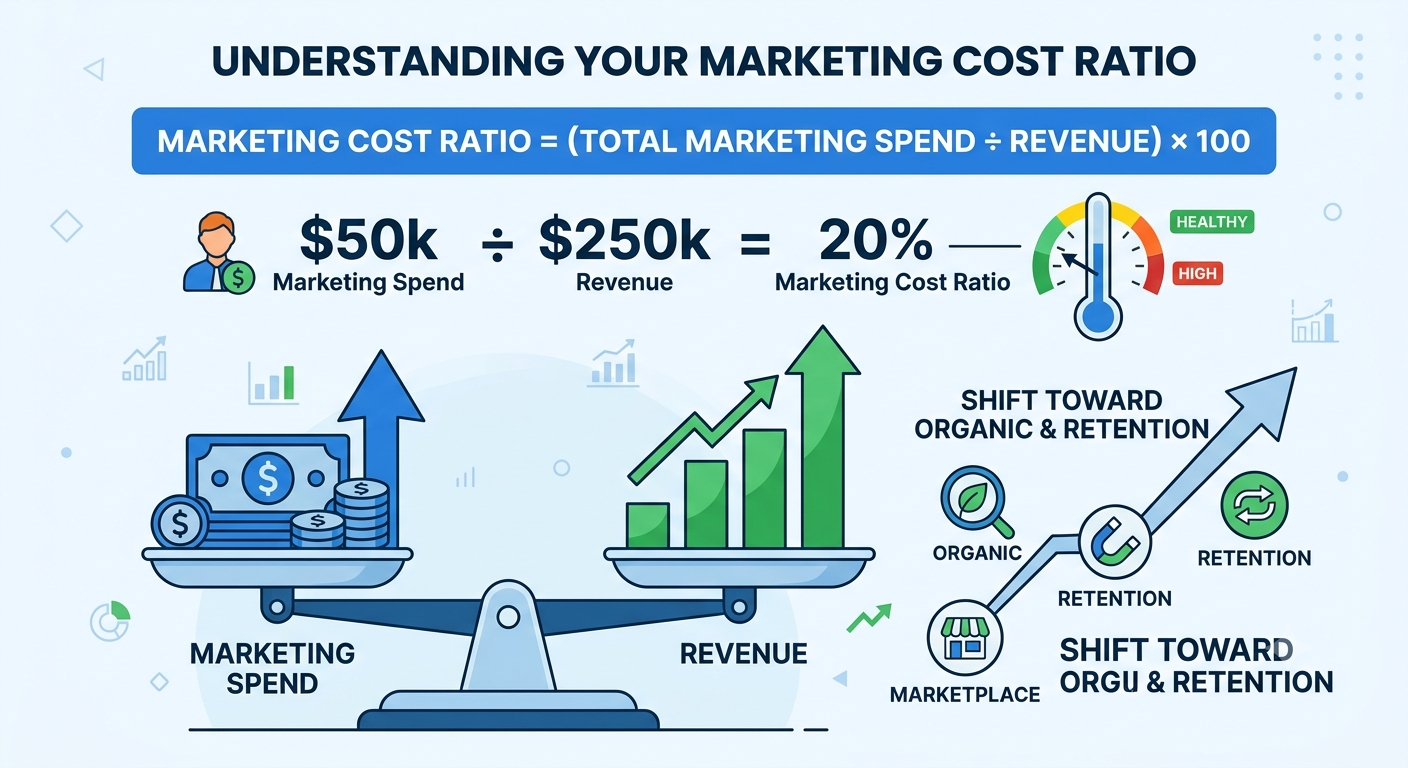
Formula: Total marketing spend ÷ Revenue
Industry standard: The public DTC cohort spent 17.2% of revenue on marketing in 2025, up 80 basis points year on year. Ad spend consumes 20-35% of revenue in broader DTC benchmark data.
How to improve it: Shift mix toward organic, retention, and marketplace-organic placement. Understanding how to calculate a profitable sale price for ecommerce products includes recognising that a SKU that only sells with paid support has a different floor than one with organic demand.
Except for the return rates, these are US and European benchmarks from Shopify-heavy or public-company samples. Indian marketplace sellers operate at lower AOVs with higher RTO and different fee stacks. Where your number sits far outside the band, that is where to look first, but do not treat the band as a goal.
Channel-Wise Profitability: How to Calculate Profitable Sale Price for Ecommerce Products by Channel
| Channel | Fee load | Contribution position | Note |
|---|---|---|---|
| Own D2C store | Payment and shipping only | Highest per unit, 8-15% net in benchmark data | Carries the full CAC burden |
| Amazon FBA | Referral plus fulfilment plus storage; benchmark data cites 25-40% combined before ad spend | 6-12 points below DTC | Organic traffic offsets some CAC |
| Flipkart Fulfilment | Comparable structure | Similar to Amazon | Verify current India rate card |
| Marketplace self-ship | Referral plus your own logistics | Between FBA and DTC | More control, more overhead |
| Quick commerce | Platform margin plus fulfilment | Varies widely | Convenience premium may support price |
Fee percentages are drawn from US-based analysis. Pull your actual India rate cards from Seller Central and Seller Hub.
The strategic point survives the caveat: DTC has the best unit margin and the worst acquisition cost; marketplaces have the reverse. A profitable business usually needs both, priced differently.
Category Reality Check: Where How to Calculate Profitable Sale Price for Ecommerce Products Gets Hardest
| Category | Gross margin position | Dominant margin threat |
|---|---|---|
| Beauty and personal care | Highest | Expiry write-off |
| Supplements and wellness | High | Subscription CAC payback |
| Apparel and fashion | High gross, weak CM1 | Returns at 25-30% |
| Consumer electronics | Lowest | Thin margin, price erosion |
| Food and beverage | Below 35% | Shelf life, high turnover need |
| Home and furniture | Moderate | Shipping and reverse logistics cost |
Electronics deserve separate mention as the mirror image. Gross margins are thin, so there is little to lose to returns or fees, but there is also almost no cushion for error. A two-point miscalculation in fee load can consume the entire contribution on a high-ASP SKU, which is why electronics sellers need the waterfall even more than fashion sellers do, despite having fewer cost lines to model.
Fashion is the category where gross margin and contribution margin diverge most violently. A 60% gross margin apparel SKU can land in single-digit CM1 once returns are properly loaded, which is why apparel brands that manage on gross margin are consistently surprised at year-end.
Five Mistakes in How to Calculate Profitable Sale Price for Ecommerce Products
- Managing on gross margin. It ignores fees, fulfilment, returns and ads, often more than half the cost stack.
- Averaging SKUs together. One hero product hides a catalogue of loss-makers consuming ad budget and operations time.
- Averaging channels together. Amazon and DTC contribution differ by 6-12 points; the blend drives no decisions.
- Omitting returns cost. In Indian fashion, this single omission can flip a price from profitable to loss-making.
- Scaling ads before break-even math. If contribution cannot support CAC, more traffic only increases losses.
Knowing How to Calculate Profitable Sale Price for Ecommerce Products Is the Whole Job
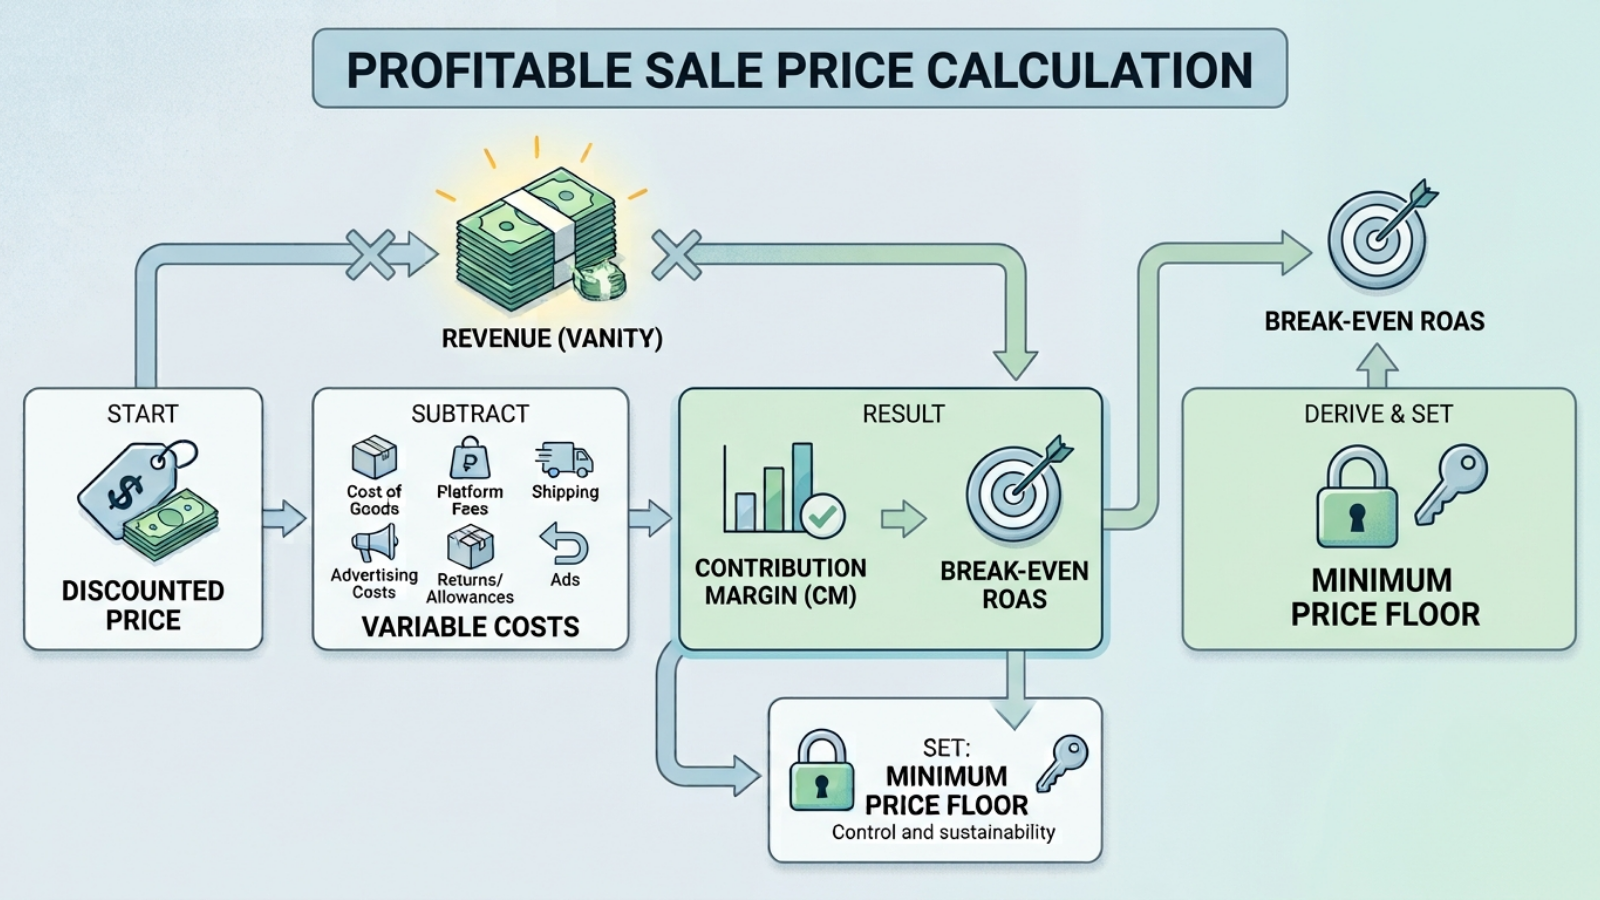
Revenue is a vanity number during a sale. Contribution is the one that survives contact with the P&L.
The method is not complicated. List every variable cost, including returns. Build CM1, then CM2. Run it on the discounted price rather than the list price. Derive break-even ROAS from contribution margin. Set the floor from that calculation and configure your systems to hold it.
What makes it fail is scale: doing this properly across a thousand SKUs and six channels is not a spreadsheet exercise. It requires clean order, fee, returns, and cost data in one place. Base.com consolidates orders, product and inventory data across channels into a single platform with price groups and configurable minimums, which is the data layer this calculation depends on.
With Indian festive GMV projected to cross ₹1.15 lakh crore in a 30-35 day window and contribution margins compressing industry-wide, the sellers who stay profitable are the ones who knew their CM1 by SKU before the discount was set.
Build the waterfall. Load the returns. Test the discounted case. Hold the floor.
Frequently Asked Questions
What is a good profit margin for ecommerce in 2026?
How do I know if my sale price is profitable?
What ROAS do I need to be profitable?
How does RTO affect the calculation of a profitable sale price for ecommerce products in India?
Should I use the same profitability target across Amazon, Flipkart and my own store?