If you’re running a D2C brand in India right now, you’ve already felt the pressure building.
Customers who once happily waited 2-3 days for a delivery are now annoyed if their order takes longer than 30 minutes. That’s not hyperbole – Blinkit, Zepto, and Swiggy Instamart have permanently rewired what Indian urban consumers consider “normal.” And once expectations shift at this scale, they don’t shift back.
Quick commerce in India crossed ₹25,000 crore in GMV in 2025. It’s growing at 40%+ year-on-year. It’s no longer just a channel for chips and cold drinks – beauty brands, nutraceuticals, pet care, baby products, and premium FMCG are building entire distribution strategies around it.
But here’s what nobody tells you upfront: getting listed is the easy part. Making the economics work, managing hyperlocal inventory, forecasting demand at pin-code level, and not quietly bleeding margin, that’s what separates the brands genuinely winning on Q-commerce from the ones who exit the channel after six months and call it “not the right fit.”
This guide covers all of it. Read it end to end and you’ll have a clearer Q-commerce strategy than 90% of D2C brands operating in India today.
What Quick Commerce Actually Is (And Why It’s Not Just Fast Delivery)
Quick commerce is not ecommerce with a faster delivery promise. It is a fundamentally different operating model built around one insight: some purchases cannot wait.
Traditional ecommerce works like this: customer orders, warehouse picks and packs, courier picks up, delivers in 1-3 days. Quick commerce flips this entirely. Inventory lives in dark stores – small, hyperlocal fulfilment centres of 1,500-4,000 sq ft spread across city neighbourhoods, never more than 2-4 km from the customer. When an order comes in, a picker grabs it off the shelf in under 3 minutes, and a delivery partner on a two-wheeler drops it at the door in 10-30 minutes.
For D2C brands, this rewires almost every distribution assumption you’ve built.
| Traditional D2C Assumption | How Q-commerce Changes It |
|---|---|
| Sell your full catalogue | Only 5-15 fast-moving SKUs work |
| Warehouse 100-500 km from the customer | Stock must live 2-4 km from the customer |
| 1-3 day delivery window | 10-30 minute delivery window |
| Unboxing experience matters | Tamper-proof, compact packaging wins |
| National demand patterns | Every pin code is its own micro-market |
| Discovery-led purchase journey | Urgency and impulse-led purchase |
The categories winning hardest right now: packaged snacks, personal care, baby care, health supplements, beverages, pet food, and home care essentials. If your product fits the “I just ran out” or “I need this tonight” mindset, this channel deserves your full attention.
How Dark Stores Work, And Why They’re the Heart of Everything
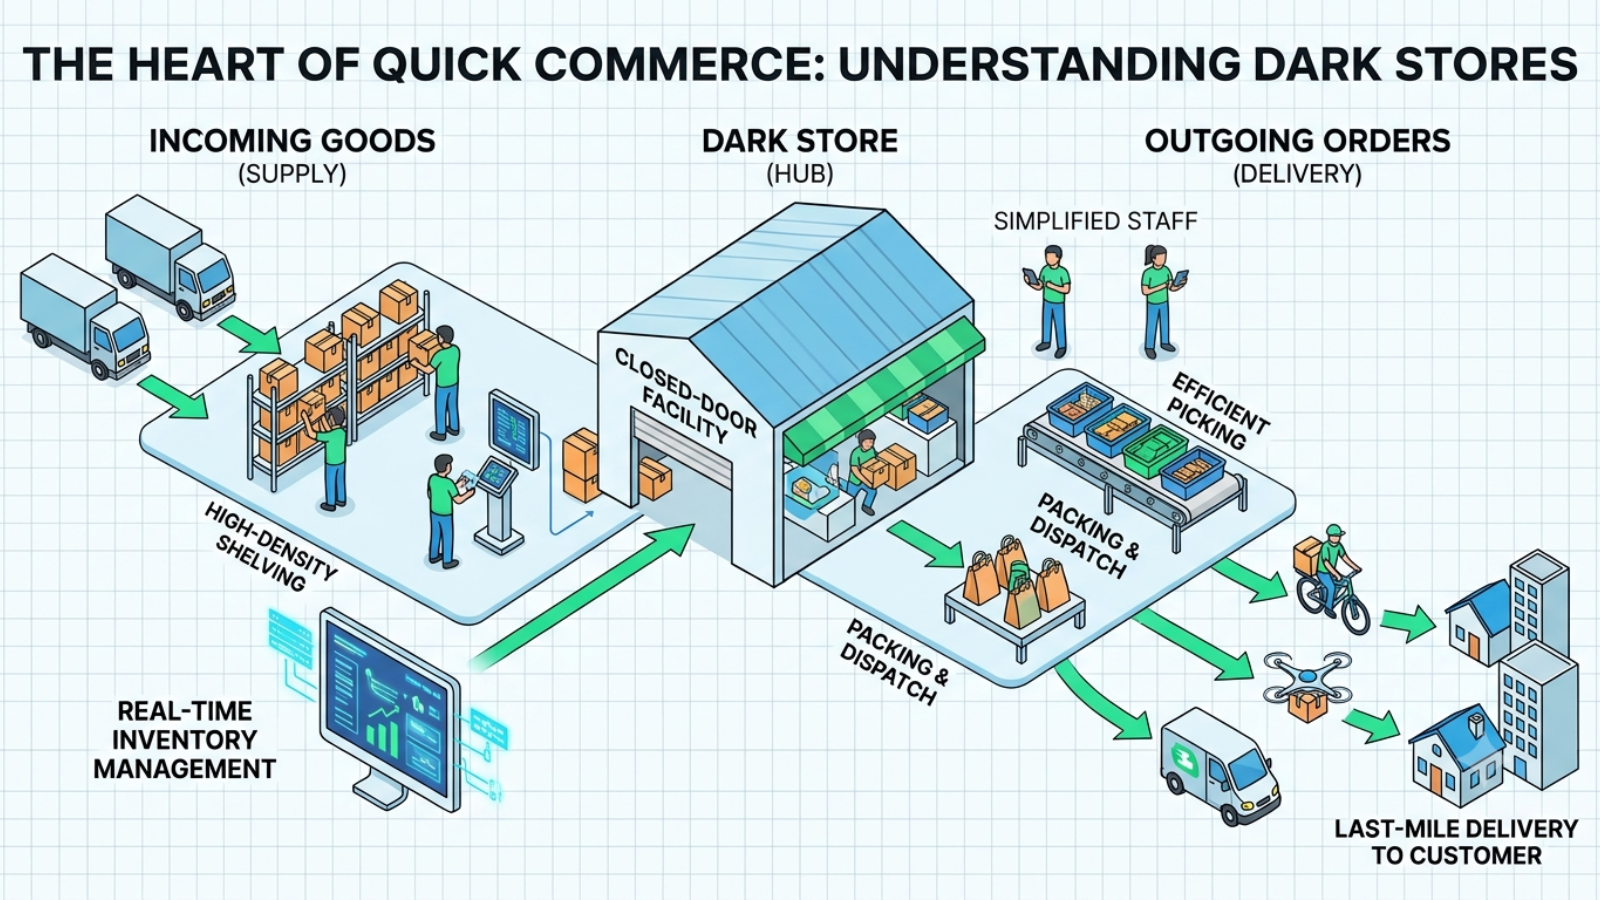 To compete in quick commerce, you need to deeply understand the infrastructure you’re plugging into, because your operational decisions are entirely shaped by how dark stores function.
A dark store is a mini-warehouse engineered for picking speed, not retail experience. No walk-in customers. No storefront. Just shelves, pickers, and a live order queue. Every shelf position is mapped to picking frequency. High-velocity SKUs sit closest to the packing station. Temperature zones manage perishables. The entire layout is a function of order data, updated continuously.
| Dark Store Feature | What It Means For You |
|---|---|
| Size: 1,500-4,000 sq ft | Limited shelf space, dead stock is expensive for you and the platform |
| SKU count: 800-2,500 products | You will not list your full catalogue here |
| Pick time target: under 3 minutes | Your packaging must be shelf-scannable, not complex |
| Replenishment: every 24-48 hours | Your supply chain to the regional hub must be flawless |
| Coverage radius: 2-4 km | Demand is hyperlocal, different neighbourhoods, different sell-through |
In India, as of early 2026, Blinkit operates 700+ dark stores across 40+ cities. Zepto has crossed 400. Swiggy Instamart runs a hybrid model, dedicated dark stores plus inventory tucked inside restaurant kitchens and partner retail outlets.
The operational implication most brands miss: when you list on Blinkit, you’re not listing on one platform. You’re listing across potentially 50 independent micro-markets, each with its own demand curve, its own competitive set, and its own fill rate requirement. Managing that complexity is the core operational challenge of Q-commerce.
The Unit Economics Most D2C Brands Get Completely Wrong
This is the section that will save you the most money. The Q-commerce P&L is not intuitive, and most brands underestimate their true cost-per-order by 20-30%.
Here is a real unit economics example. You sell a face wash at ₹299 MRP listed on Blinkit.
| Line Item | Amount |
|---|---|
| MRP | ₹299 |
| Blinkit commission (22%) | -₹66 |
| GST on commission (18%) | -₹12 |
| COGS (product cost) | -₹90 |
| Inbound logistics to the dark store | -₹8 |
| Returns and damage provision (3%) | -₹9 |
| Gross contribution per order | ₹114 (38%) |
| Platform marketing-sponsored listing | -₹25 |
| Net contribution per order | ₹89 (30%) |
30% net contribution sounds acceptable until you realise your D2C website sells the same product at 62% gross margin with full customer data and zero platform dependency. The Q-commerce channel is not bad, but it must be engineered for, not just plugged into.
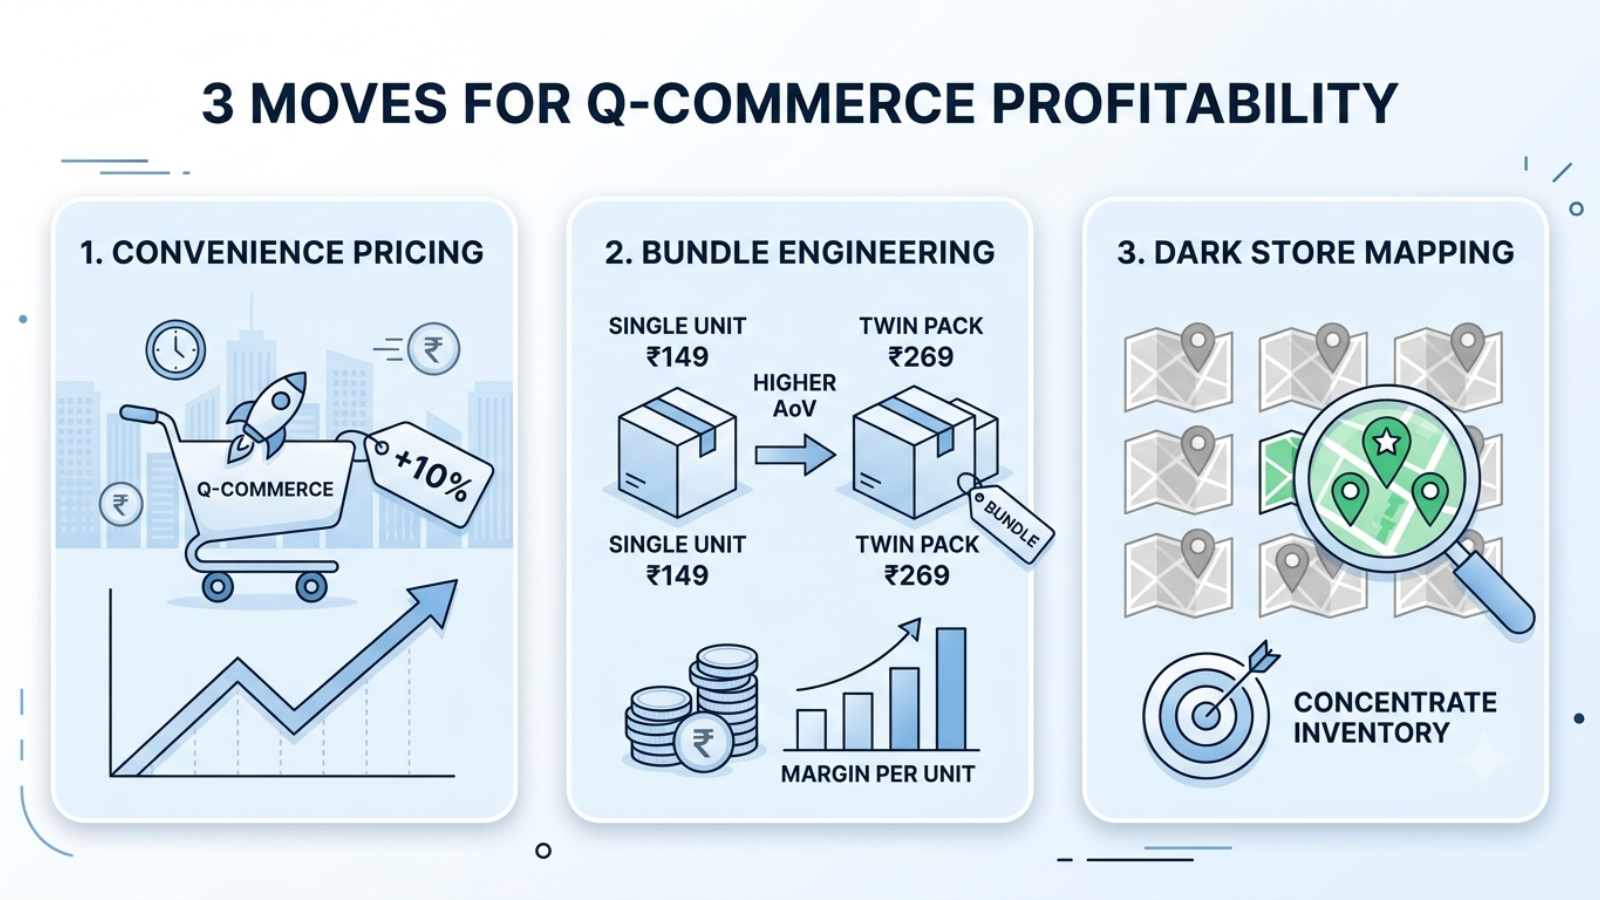 The three moves that separate profitable brands from the rest:
- Convenience premium pricing. Price your Q-commerce SKUs 8-15% higher than your website. Urban consumers aged 25-40 buying on Blinkit are paying for speed. They are largely price-inelastic on habitual replenishment purchases. Don’t leave that premium on the table.
- Bundle engineering. A twin-pack at ₹269 instead of a single unit at ₹149 improves economics significantly. Same commission percentage, higher AoV, better per-unit margin. Design your pack architecture specifically for Q-commerce basket targets.
- Dark store profitability mapping. Not every dark store location is profitable for your SKU. Identify your top 10 performing stores by contribution and concentrate your inventory and marketing there rather than spreading thin across every location.
Choosing Between Blinkit, Zepto, and Swiggy Instamart
This is the question every D2C founder asks first. The honest answer: it depends on your category, your city concentration, and your margin structure.
| Platform | Best For | Core Strength | Watch Out For |
|---|---|---|---|
| Blinkit | Premium FMCG, established brands | Highest dark store density in the top 6 cities, best brand dashboards, and highest AoV customers | Higher commission, strong platform leverage in negotiations |
| Zepto | Youth-skewing brands, impulse categories | Fastest delivery under 12 minutes, strong 22-32 demographic, aggressive growth | Exclusivity push, smaller city coverage |
| Swiggy Instamart | Tier 2 expansion, food-adjacent brands | Widest city coverage, cross-sell from food orders, and more flexible for new brands | Lower average order values, less mature brand tools |
The multi-platform trap is real. Many brands list on all three simultaneously without the inventory or operational bandwidth to maintain fill rates on each. The result is poor rankings everywhere instead of a strong position on one platform. Start with one, get your operations right, then expand with the data to justify it.
10 Things About Quick Commerce That Most D2C Brands Never Find Out
This is where most guides stop. What follows are ten things the industry rarely talks about openly, each one tied to a topic that deserves its own deep read, and each one capable of changing how you approach the channel entirely.
1. Your Ranking on Blinkit Is Secretly a Fill Rate Score
 Most brands think their Q-commerce ranking is about how much they spend on sponsored listings. It’s not. The single biggest driver of organic ranking on Blinkit and Zepto is fill rate, the percentage of time your SKU is actually available when a customer searches for it. A brand spending ₹50,000 a month on sponsored ads with a 78% fill rate will consistently lose ranking to a brand spending ₹10,000 with a 96% fill rate.
This is why hyperlocal inventory management is not an operational nice-to-have. It is a marketing investment. Every stockout is a ranking penalty that costs you organic visibility for days or weeks after the stock is replenished. The brands that understand this restructure their entire supply chain priorities around Q-commerce fill rates before they spend a single rupee on platform advertising.
2. Q-commerce Demand Forecasting Requires a Completely Different Mental Model
 Your existing demand forecasting tools, built for D2C websites or modern trade, do not work for Q-commerce without significant reconfiguration. The reason is structural: Q-commerce demand is hyperlocal, volatile, and driven by triggers your historical data has never seen.
Rain on a weekday evening spikes comfort food orders by 40%. An IPL match night pushes snack and beverage velocity up 60-80%. A food blogger posting about your product in the afternoon can empty a dark store shelf by evening. These are not edge cases; they are the recurring reality of Q-commerce demand planning.
What works: 3-7 day rolling forecasts updated daily at the dark store cluster level, event-triggered inventory buffers pre-positioned 4-5 days before known demand spikes, and stockout alerts the moment a dark store’s top SKU drops below 36-hour cover. Monthly forecast reviews are already stale before the ink dries.
3. The Last Mile Is Where the Economics Go to Die — If You Own It
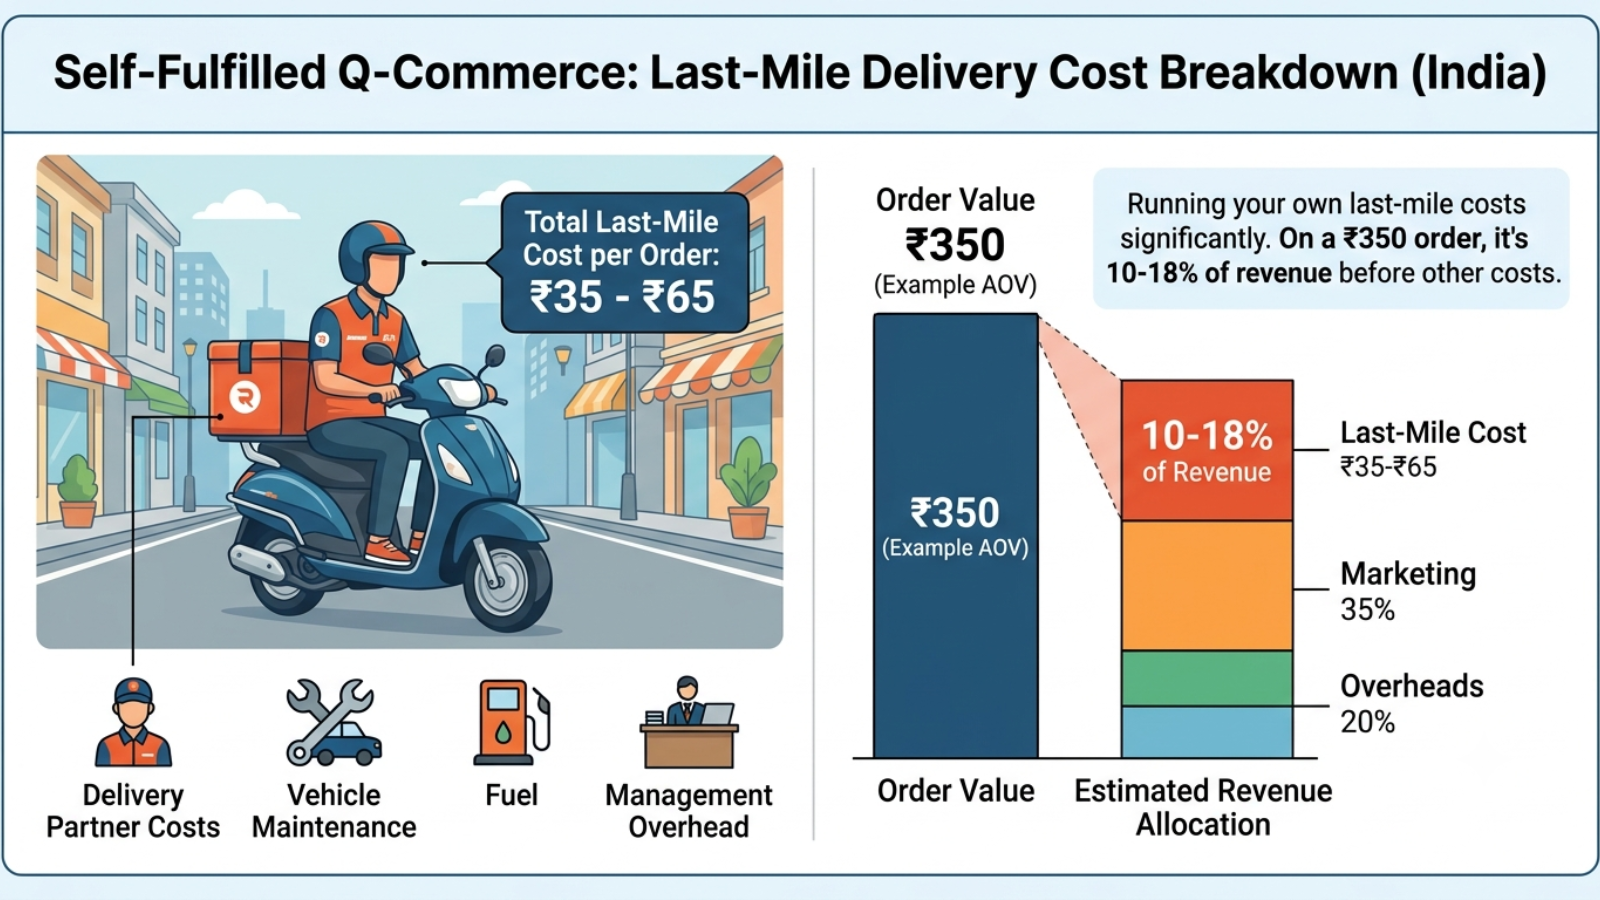 If you’re running your own Q-commerce fulfilment rather than using an aggregator’s last mile, last-mile delivery costs in India typically run ₹35-₹65 per order once you account for delivery partner costs, vehicle maintenance, fuel, and management overhead. On a ₹350 average order value, that’s 10-18% of revenue before you’ve counted product cost, marketing, or overheads.
The lever that moves this number most dramatically is dark store density, not delivery partner incentives, not route optimisation software. Every additional kilometre in the average delivery radius adds cost and time in a non-linear way. Brands achieving a sub-2 km average delivery radius consistently report last-mile costs 35-40% lower than those operating from 4-5 km. This means the decision about where to locate your dark store is the most important unit economics decision you will make.
4. Most Brands Are Listing the Wrong SKUs and Don’t Know It
 Shelf space in a dark store has an opportunity cost measured in GMV per square foot per day. Aggregators know this and will quietly delist your slow movers, often without a formal conversation. The brands that thrive have learned to be brutal about SKU selection before the platform forces their hand.
The products that consistently outperform on Q-commerce share four traits: urgency-driven replenishment (running out triggers the purchase), small pack or single-serve formats that fit a ₹350-₹450 average basket, immediate category recognition that converts in a 15-second scroll, and either existing brand equity or very loud packaging communication. Products requiring education, consultation, or considered purchase simply do not convert in this context. Q-commerce is closer to a convenience store shelf than a browsable website; the rules of retail apply more than the rules of ecommerce.
5. Platform Pricing Architecture Is a Strategic Decision, Not an Admin Task
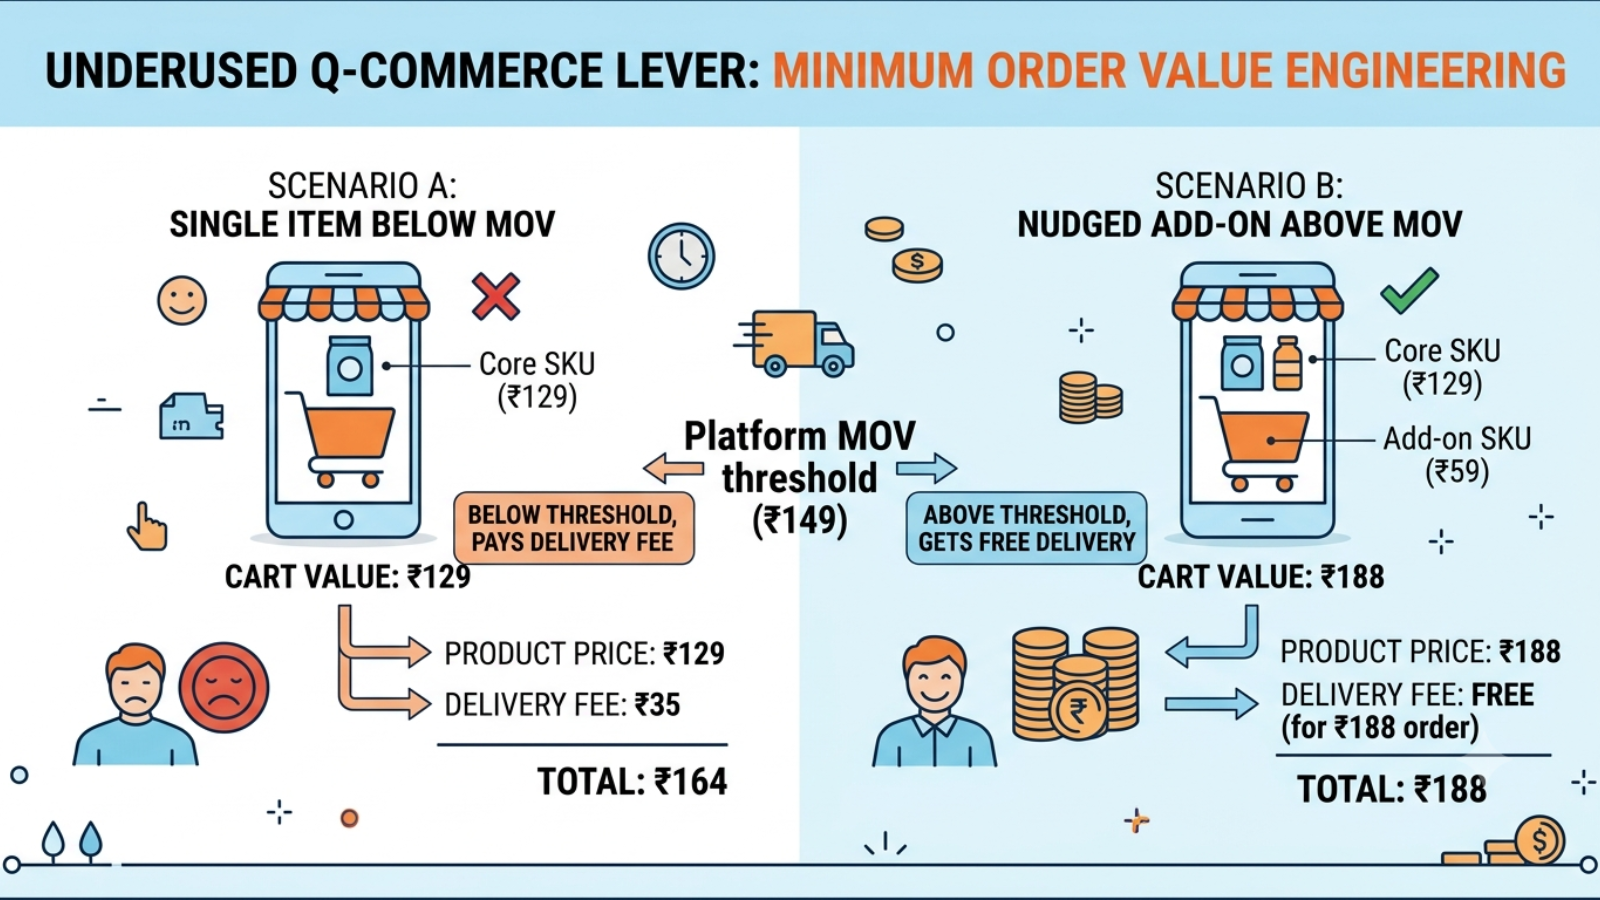 Minimum Order Value engineering is one of the most underused levers in Q-commerce. Most platforms waive delivery fees above ₹149-₹199. Below that threshold, customers pay ₹25-₹49 in delivery fees. As a brand, you want your core SKUs priced just below the MOV threshold, nudging customers to add one more item to their cart. And that add-on should ideally be another one of your SKUs, not a competitor’s.
The smarter brands design their entire Q-commerce catalogue architecture around MOV dynamics. A hero SKU at ₹139 paired with a complementary SKU at ₹99 means most customers who start with one end up buying both to hit free delivery. That’s not an accident, it’s deliberate catalogue engineering. Add convenience premium pricing (8-15% above your website for the speed benefit), and the economics of Q-commerce become substantially more defensible.
6. The Basket Size Gap Between Q-commerce and Ecommerce Is a Product Design Problem
 The average Q-commerce basket in India is ₹350-₹450. The average D2C website basket is ₹800-₹1,200. Most brands see this gap and assume Q-commerce customers are lower-value. That’s the wrong conclusion. The gap exists because the purchase context is completely different, not because the customers are different people.
On your website, a customer browses, compares, reads reviews, and builds a considered cart over 8-12 minutes. On Blinkit, they have one thing in mind: to order in under 90 seconds. The fix is not to make Q-commerce behave like your website. It’s to design products and bundles specifically for the Q-commerce purchase context. A “Night Routine Kit” listed as a single SKU converts better than hoping customers add three individual products. A 3-pack at ₹399 effectively triples basket value while giving customers a genuine deal. These are product design decisions, made before the listing goes live.
7. Q-commerce Marketing Has an Off-Platform Secret Weapon
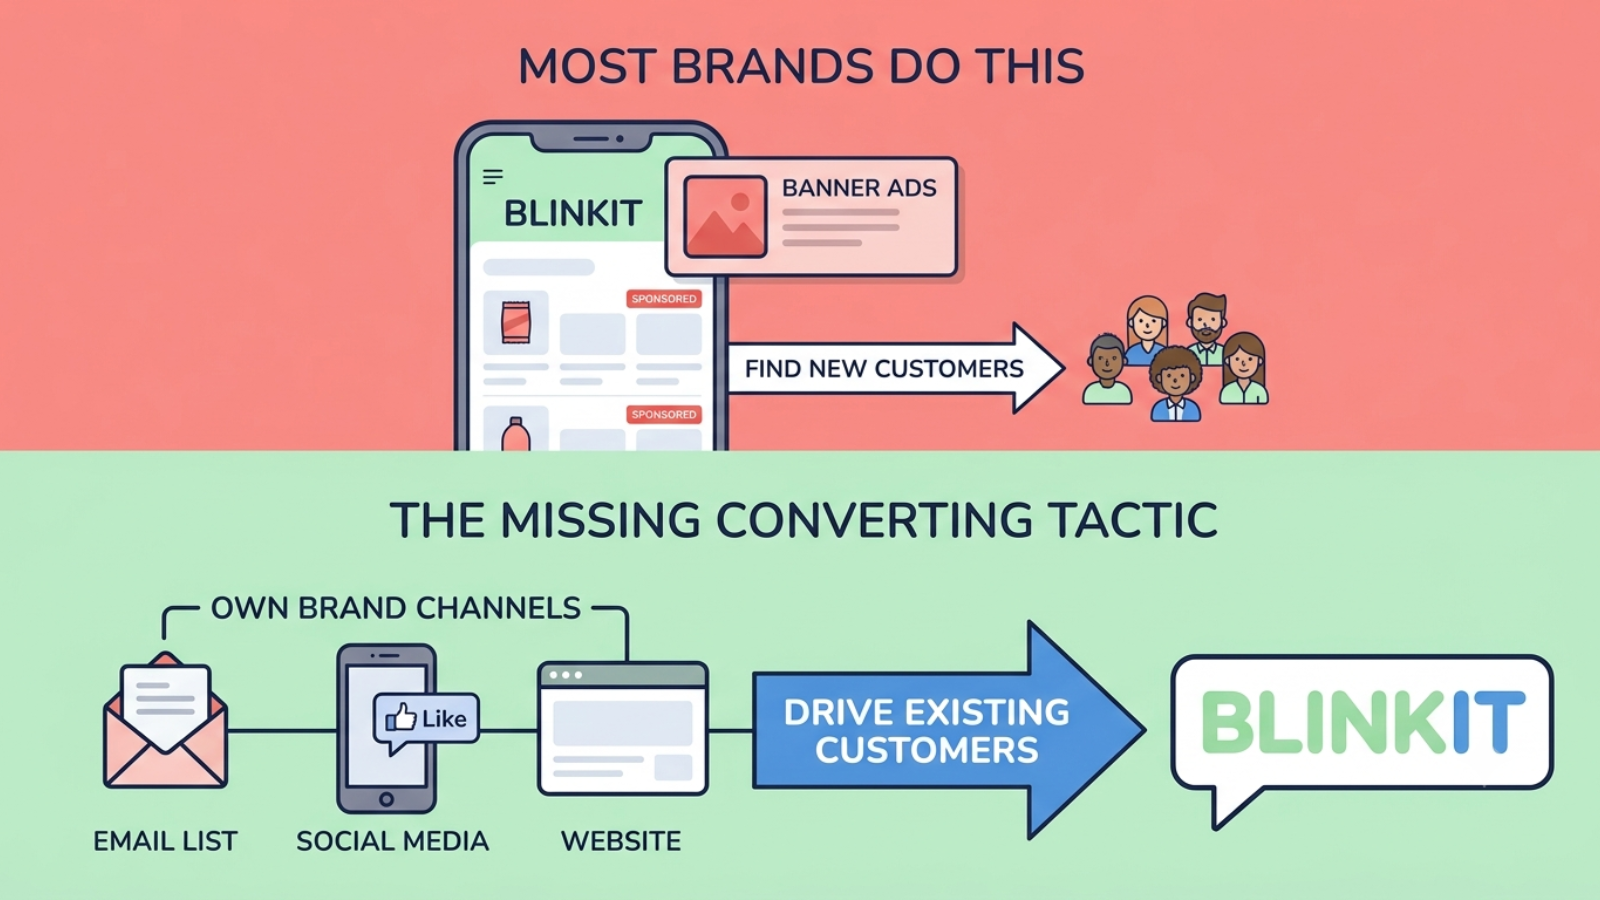 Most brands think Q-commerce marketing means spending on sponsored listings and banner ads on Blinkit. And platform marketing does matter, but the most consistently high-converting Q-commerce marketing tactic is one most brands never deploy: using your own channels to drive existing customers to the platform.
An Instagram story or WhatsApp broadcast to your existing customer base saying “Now available on Blinkit, delivered in 10 minutes” converts at 3-5x the rate of cold in-app discovery. These customers already trust your brand. They simply didn’t know they could get you in 10 minutes. A single well-targeted email to your CRM list can spike dark store velocity enough to trigger organic algorithm uplift, which then sustains improved ranking for weeks. This off-platform pull-through tactic costs essentially nothing and delivers compounding platform ranking benefits that paid ads cannot replicate.
8. You Have Almost No Customer Data — But You’re Not Powerless
 One of the hardest structural realities of Q-commerce: when you sell through Blinkit or Zepto, you receive almost no customer-level data. You know what sold, where, and when, but not who bought it, what their purchase history looks like, or how to build a direct relationship with them.
This is a real disadvantage. But the brands navigating it well have found three practical responses. First, hyperlocal sell-through data is richer than it looks. A velocity spike in one pin code can reveal a new residential development, a competitor stockout, or a demographic shift worth acting on for offline retail expansion decisions. Second, loyalty programmes and post-delivery email capture (through packaging inserts or delivery confirmation flows) can stitch Q-commerce buyers into your CRM over time. Third, cross-channel cohort analysis, tracking whether repeat purchase rates on your own website increase in cities where you have a strong Q-commerce presence, gives you indirect evidence of Q-commerce’s brand-building effect. Data poverty requires creativity, not surrender.
9. Returns Are Lower Than You Think — But Reverse Logistics Is More Broken Than You’d Expect
 The good news about Q-commerce returns: they’re low. Typically 2-5%, versus ecommerce’s 15-25%. When you receive a product in 15 minutes, you’re less likely to have bought the wrong variant, changed your mind during shipping, or been disappointed by an inflated wait. The category also matters; consumables and personal care have structurally lower return rates than apparel or electronics, regardless of the channel.
The bad news: when returns do happen in Q-commerce, the reverse logistics infrastructure in India is still largely undeveloped for this channel. A return from a dark store goes back to the regional hub, which may hold it for 3-7 days before it’s restocked or written off as damaged. During that window, you’ve lost both the sale and the inventory availability, a double hit. The practical response is to build a 3-5% returns and damage provision into your unit economics from day one, work with your aggregator account manager to get real-time return data by dark store, and make return eligibility decisions by category rather than applying a blanket policy.
10. The Profitability Question Has a Real Answer — But Only If You Ask It Honestly
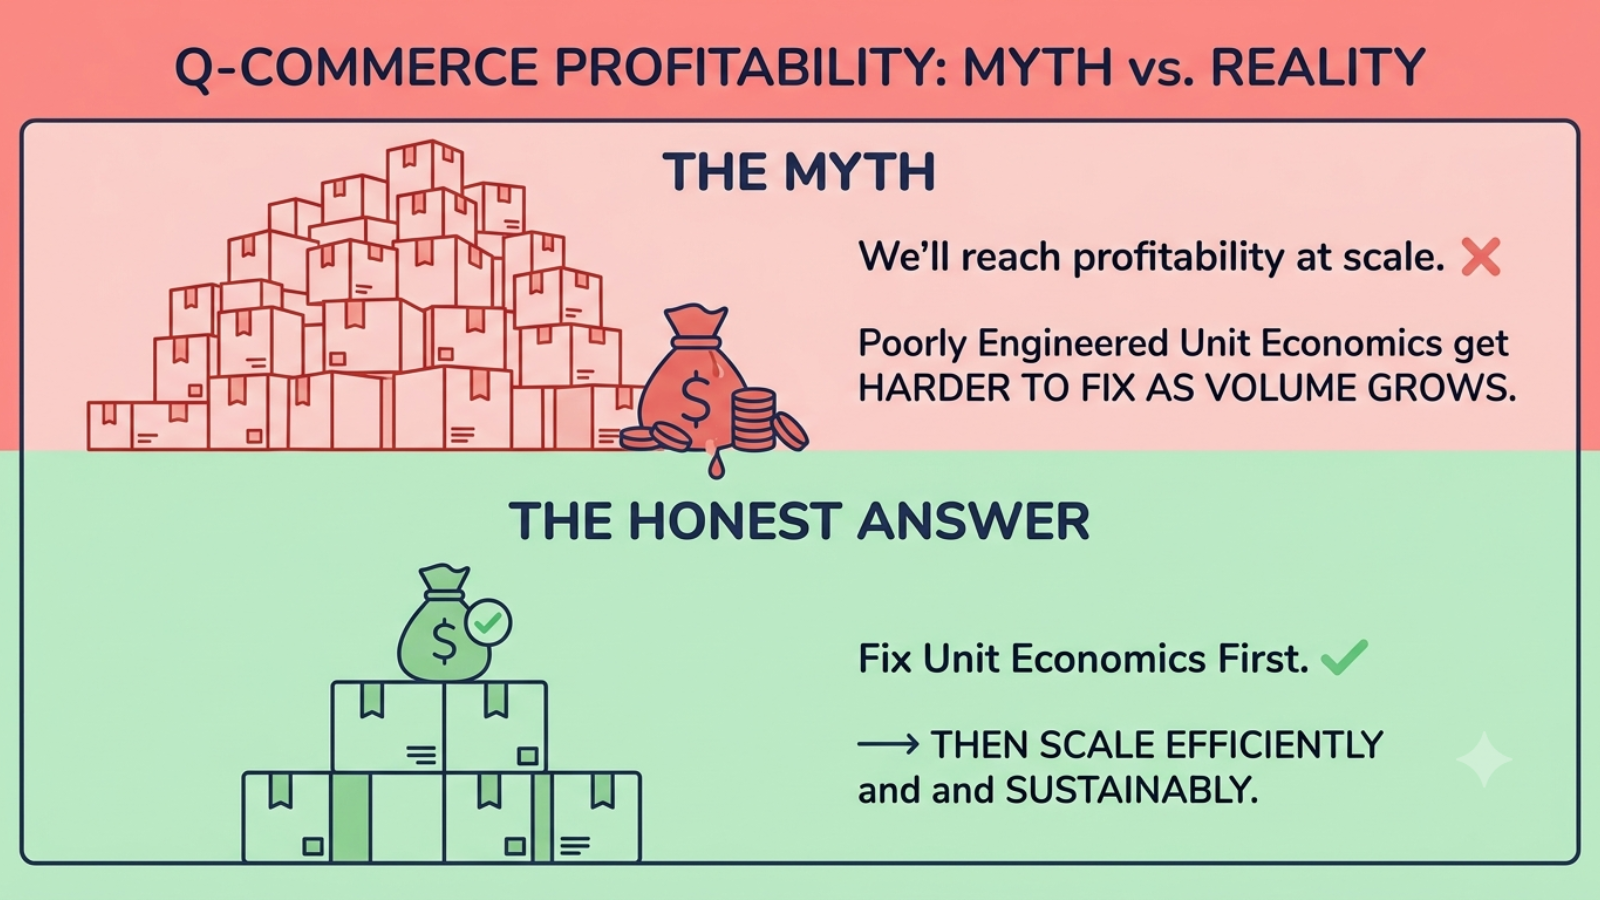 The biggest myth in Q-commerce: “We’ll reach profitability at scale.” For some brands, that’s true. For many, it’s a rationalisation for poorly engineered unit economics that get harder to fix as volume grows.
The honest profitability test for Q-commerce has three parts. First, is your net contribution per order, after commission, COGS, inbound logistics, returns provision, and platform marketing, positive at your current average order value? If not, does your pricing or bundle architecture have a clear path to making it positive, or are you structurally reliant on volume discounts that may or may not materialise? Second, is Q-commerce building customer habits that generate lifetime value you can measure, through repeat Q-commerce purchases, cross-channel migration to your website, or demonstrably increased brand awareness in Q-commerce cities? Third, what is the opportunity cost of the working capital, operational bandwidth, and management attention you’re directing at this channel versus other distribution options?
If all three answers support Q-commerce investment, build aggressively. If they don’t, a focused, selective approach, like fewer SKUs, fewer cities, better economics, is almost always more valuable than a broad presence that quietly subsidises orders indefinitely.
The Tech Stack You Actually Need
Running Q-commerce operations without the right technology is the fastest route to the stockout-ranking spiral that kills most brand performances on the channel.
| Layer | What You Need | Why It Matters |
|---|---|---|
| Order Management | Real-time order visibility across all platforms | Without this, you’re managing Blinkit on one spreadsheet and Zepto on another |
| Inventory Management | Dark store-level stock tracking with auto-replenishment triggers | The most common gap, most brands have no real-time view of pin-code level stock |
| Demand Forecasting | SKU-level, location-level rolling forecast | Generic forecast tools will consistently under- or over-stock |
| Platform Integration | API connections to aggregator dashboards | Manual data export creates a 24-48 hour lag that makes stockout response impossible |
| Analytics | Hyperlocal sell-through, ranking tracking, and contribution per dark store | You cannot optimise what you cannot see |
| Last-Mile (if owned) | Route optimisation, delivery partner management | Batch clustering and partner retention are the two biggest last-mile cost levers |
The most common tech gap in Indian D2C brands entering Q-commerce: no single source of truth for dark store-level inventory. Solving this before you scale is not a nice-to-have. It is the foundation that every other Q-commerce operational decision rests on.
What the Next 24 Months Look Like
Quick commerce in India is not evolving. Five things are coming that will reshape the landscape for D2C brands before 2028.
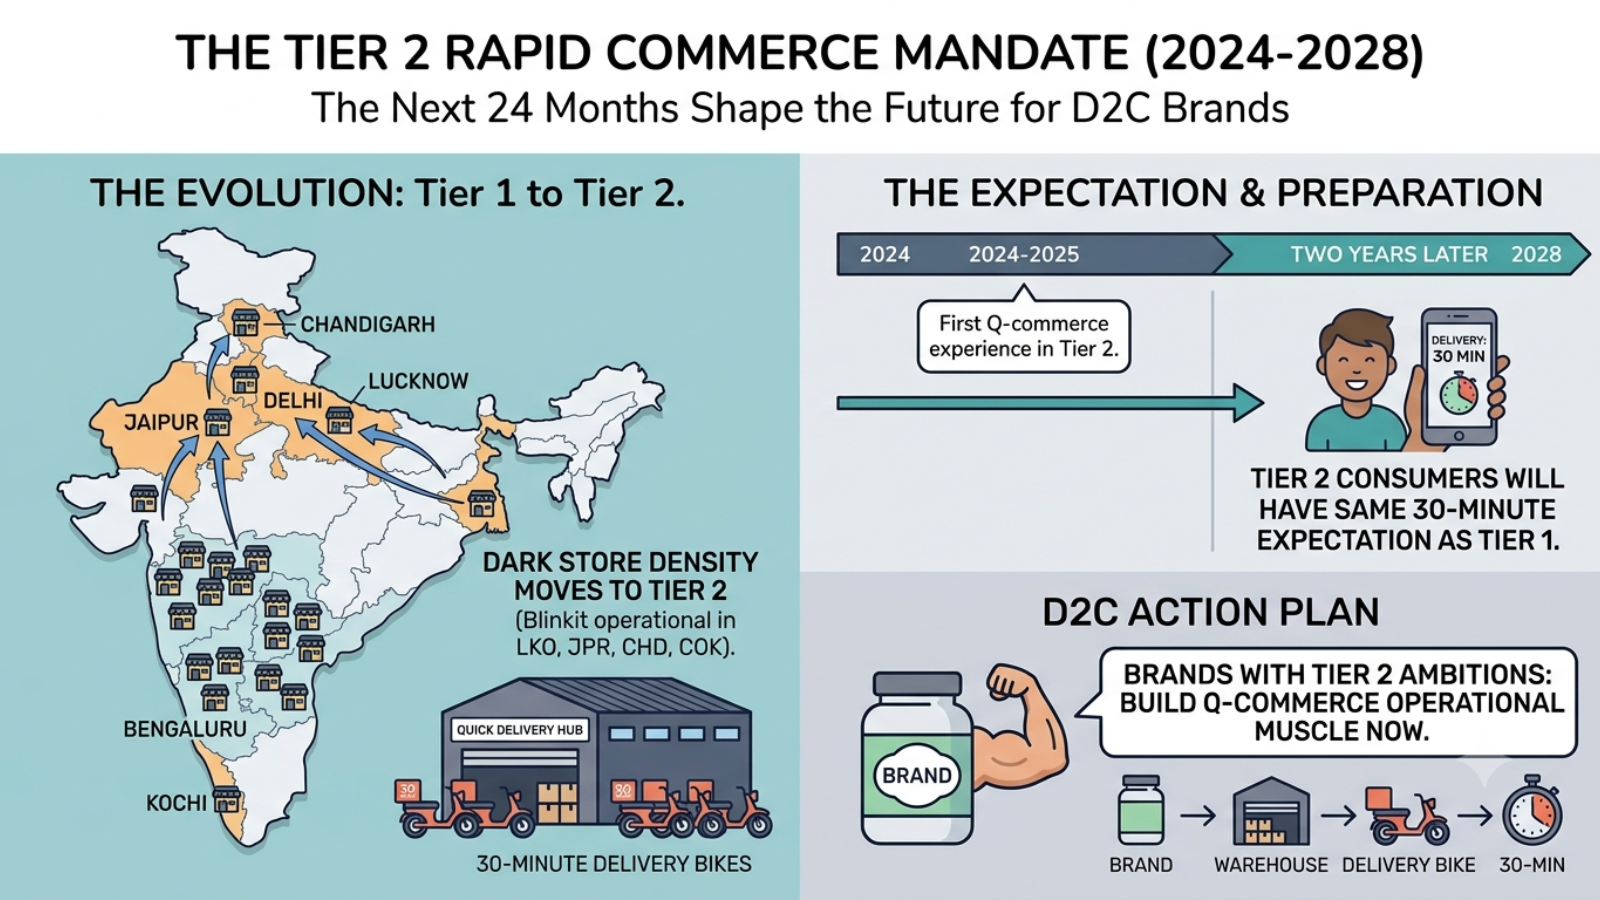 Dark store density is moving to Tier 2 cities. Blinkit is already operational in Lucknow, Jaipur, Chandigarh, and Kochi. The Tier 2 consumer who experienced Q-commerce for the first time in 2024-25 will have the same 30-minute delivery expectation as a Bengaluru customer within two years. Brands with Tier 2 ambitions need to start building Q-commerce operational muscle now.
Platform private labels are coming for your category. Blinkit’s private labels are already live in staples and creeping into personal care. The brands that build enough consumer equity to be irreplaceable will survive this. The brands competing purely on price or convenience without a clear differentiation story will not.
AI-driven hyperlocal forecasting will become a partnership tool. Platforms are investing in pin-code level demand prediction and will increasingly share this data with brand partners who have the technical capability to consume it. This will create a significant operational advantage for brands with mature data infrastructure versus those still managing on spreadsheets.
Sustainability pressure on Q-commerce packaging will intensify. As volumes scale, regulatory and consumer pressure on single-use packaging in last-mile delivery will grow. Brands investing in compact, sustainable Q-commerce packaging now will avoid a forced transition at scale.
The winner in Q-commerce over the next two years will not be the brand with the most dark store listings or the highest ad spend. It will be the brand that has done the unglamorous work, clean unit economics, reliable fill rates, hyperlocal inventory intelligence, and a genuine understanding of which SKUs belong on which platform in which city.
That work starts here.
The brands winning on quick commerce in India are not the ones that moved fastest to get listed. They are the ones who treated Q-commerce as a distinct business model, with distinct economics, distinct operations, and distinct marketing, not a bolt-on to their existing D2C setup. That distinction is what this guide is built to help you make.